
Dissertation Gantt Chart | A Complete Guide
Table of contents.
- What Does a Dissertation Gantt Chart Represent?
- Key Elements Include in Dissertation Gantt Chart
- How to Make a Gantt Chart for Your Dissertation?
Dissertation Gantt Chart Templates?
Designing a custom gantt chart for your dissertation.
- Why Is a Gantt Chart for a Dissertation Important?
Benefits of Using Gantt Chart in Dissertation
.webp)
Author : Vipul Jain
- Dissertation
Key Takeaways
- A dissertation Gantt chart represents the schedule for a dissertation project, adding their start and end dates, any dependencies between them, and the tasks. Gantt chart helps you" Manage your time, Anticipate delays, Understand workflows and establish realistic time frames".
- Key Elements Include in Dissertation Gantt Chart such as" Tasks, Milestone, Dependencies, Critical Path, Timeline, Work breakdown structure, and resources".
- Some tips that help you make a Gantt Chart for your dissertation include" Determine Dependencies, Determine the Major Phases, Divide Phases into Tasks, Create the timetable, and Add key points".
- Dissertation Gantt Chart templates are a great way to simplify the process. It helps students plan and manage their dissertation projects by completing tough tasks on time. Here are typical sources for the Gantt chart PhD template like " MS Excel Templates and Google Sheets Templates".
- Gantt chart for a dissertation is important because Gantt chart helps you "Plan your time, Visualize your progress, Identify potential delays, Collaborate with others, Communicate with stakeholders".
- Gantt Chart is beneficial for dissertations for many reasons such as" Project tracking, Task dependencies, Resource management, Collaboration, Time management and assigning tasks".
What Does a Dissertation Gantt Chart Represent?
A guide to writing the dissertation , Gannt Chart the plays a vital role. it's a visual way to track our dissertation progress on time.
- Organize Time: A dissertation Gantt chart example is a visual presentation of a project's timeline. It is usually used in research projects to plan, track, and manage the many parts and tasks of completing a dissertation writing.
- Establish realistic time frames: It visually shows how much time is spent on each task and their order, or dependent tasks. The dissertation helpers can keep track of going and stay on plan more easily as a result of this.
- Timeline: A Gantt Chart is a bar chart that puts in order a dissertation project's schedule and tasks and shows a timeline of your project. It can be used in many industries such as" engineering, event planning, software development, and construction".
- Organization: Best Online Dissertation Helpers use the Gantt Chart to complete the work on time. A dissertation helper can help you plan tasks, projects, and deadlines, allocate resources, and keep everyone on track.
Key Elements Include in Dissertation Gantt Chart
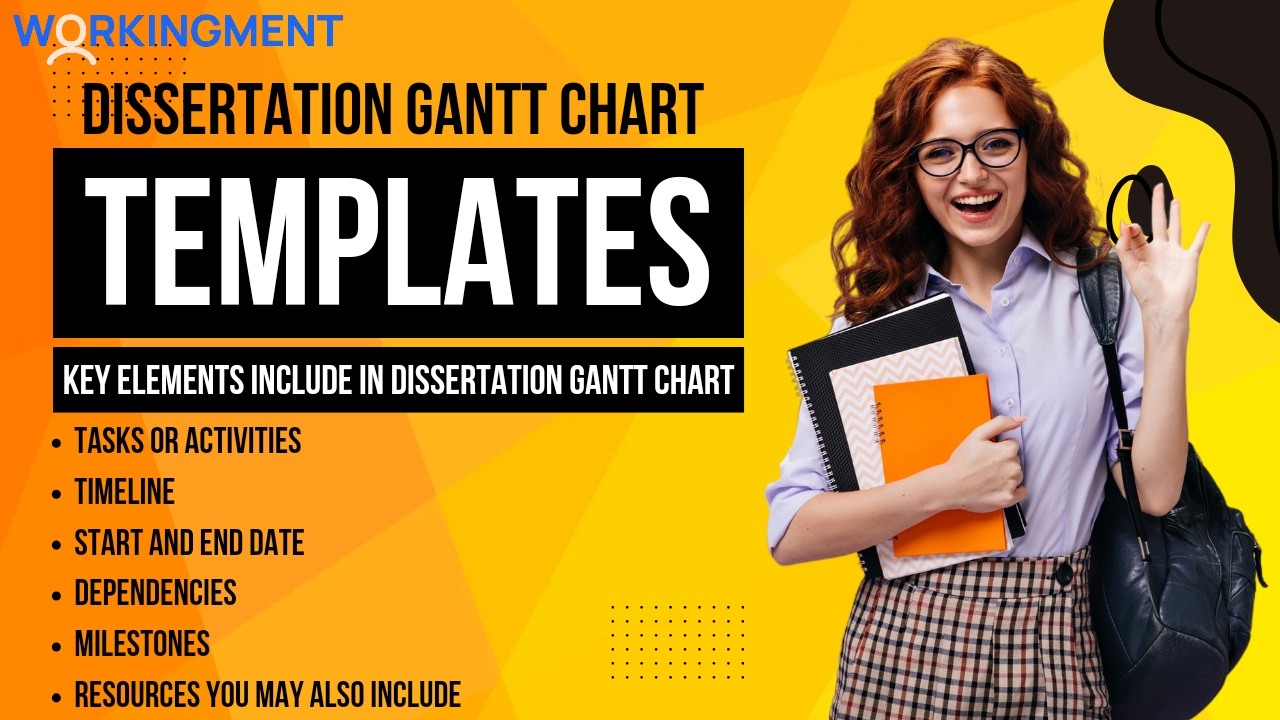
Here are the following key elements we should include while writing a Dissertation Introduction to adding references in the last. So let’s know all the key elements of the Dissertation Gantt Chart.
Tasks or Activities: Each crucial stage of the dissertation process ought to be categorized as a task. Writing a Gantt chart dissertation proposal submission, a guide to writing the dissertation literature review , data collection and analysis, writing, revisions, and final submission are all examples of these.
Timeline: The project's duration is shown on the timeline. It is frequently divided into weeks or months, depending on the project's length.
Start and End Dates: Include specific start and end dates for each task. This ensures that the project stays on track and lets you see how long each task should take.
Dependencies: Some tasks cannot begin until other tasks are finished. The chart should indicate these dependencies to complete the dissertation on time. Many Dissertation Writing Services in the UK are dependent on the Gantt chart dissertation.
Milestones: Milestones are important points in the project, like when a chapter is finished or a draft is submitted. They aid in progress monitoring and momentum preservation.
Resources You may also include resources like software, data sources, or advisors that will be required to complete each task in some Gantt chart dissertation examples.
Gantt Chart includes references , so you should know how to write a dissertation conclusion and references .
Progress Tracking: There is a feature in some Gantt charts that lets you see how much of a task has been completed. Usually, this is shown by shading a portion of the taskbar.
All the points are very beneficial to completing a dissertation, because lots of students in the UK, don’t know how to make a Gantt Chart dissertation, they need Perfect Dissertation Help in London for a Research Project .
View this post on Instagram A post shared by workingment (@workingment_)
How to Make a Gantt Chart for Your Dissertation?
Using Excel or other project management software, you can manually create a Gantt chart for your dissertation. Many Assignment Helpers or UK-based experts make the Gantt Chart using Excel. So let's know a step-by-step guide to creating a PhD Gantt chart is provided below:
Determine Dependencies: Look for tasks that require other people to finish them.
Determine the Major Phases: To begin, determine the major phases of your dissertation. Planning, literature review, methodology development, data collection, analysis, writing, and revision are typically included.
Divide Phases into Tasks: Once the phases have been identified, divide them into smaller, easier-to-manage tasks. Tasks might include, for instance, identifying sources, reading and summarizing sources, and writing the review during the literature review phase.
Create the timetable: Create a timetable for your dissertation project/task using Excel or another project management tool or software that you are comfortable using.
Add key points - Mark important key points on the chart, such as when key chapters/ topics have been done or drafts have been submitted. Review Gantt chart examples to get a clearer idea of how to track your progress.
Dissertation Gantt Chart Templates are a great way to simplify the process, helping students complete difficult tasks on time, just like we write acknowledgements in dissertation .
The following are typical sources for the Gantt chart PhD template:
MS Excel Templates- MS Excel includes many user-friendly and customizable Gantt chart templates. You can easily create basic charts on MS Excel.
Google Sheets Templates: Google Sheets has templates that can be easily changed/ customizable and shared with anyone, just like Excel does. With Google Sheets, we have access to use it anywhere and on any device with an ID/ password.
Creating a Gantt Chart for a dissertation requires entering customer task names, durations, and start dates into an Excel spreadsheet and later using the built-in tools to insert a Gantt chart. Here are some points that help you how to design a custom Gantt chart for a dissertation
Determine Custom Objectives
It's important to determine custom objectives and what they want to achieve before diving into using the title. Having a clear understanding of custom aims will help you use the title effectively even if it's organizing a project, tracking progress, or managing tasks.
Break Down the Project into Stages
Recognize the key points required in completing customer research like as data collection, data analysis, proposal writing, and literature review".
List Tasks Within Each Stage
Complete all the specific tasks that are required and delve deeper into each research stage and accurate list. Complete all the specific tasks that are required and delve deeper into each research stage and accurate list. The "literature review" stage might require tasks like recognizing relevant academic databases, summarizing key findings, and searching for articles, for example.
Estimate Task Durations
Estimate task duration for completing each individual task within custom research stages. Look at factors like the resources available and the complexity of the task.
Recognize Task Dependencies
Pinpoint any dependencies and analyze the sequence of custom tasks. It can't start until the data collection stage is complete Make sure that you have the data analysis example. Plot these dependencies in a custom Gantt chart make sure a smooth and logical workflow.
Utilize Features
Effortlessly create custom Gantt charts that leverage the user-friendly interface. Estimated durations, tasks and input your research stages.
Track Progress & Make Adjustments
Recognize any potential roadblocks that might arise and be prepared to adjust custom plans as needed.
Why Is a Gantt Chart for a Dissertation Important?
There are many reasons why a dissertation Gantt chart for a thesis is important, but it provides a visual look and solves challenges easily while writing a dissertation discussion section .
Time Management:- The dissertation helps in efficient time planning and management. You can promise that you are reliably making progress toward completing your dissertation writing by making deadlines for each task of the dissertation.
Vision Clarity:- The Gantt chart's graphic nature makes it easy to understand the timeline and task sheet for proper understanding.
Task Arranging:- The chart supports task arranging by showing which tasks can be completed parallel and which are dependent on other tasks of the dissertation.
Improved Communication: A Gantt chart can help you communicate better with dissertation helpers.
Boosted Organization By breaking down the difficult process of writing a dissertation into smaller, more handy tasks, a Gantt chart helps you stay prepared.
Flexibility: A Gantt chart is not fixed. It is flexible to the change of your project.
Reduction of Stress: Writing a dissertation can be stressful if you have a strategy in place. It confirms that you have enough time to review and recheck your work/project.
Any graduate student working on a research project will benefit greatly from having a dissertation Gantt chart for selecting the best dissertation topics to complete the dissertation. It helps you manage your time, keep track of your progress, and make sure you meet your deadlines by providing a clear visual representation of the timeline and tasks involved. Using a Gantt chart, you can break down the project into many steps and set realistic deadlines, which can help you finish your dissertation on time and with less stress.
The most important thing is to make your Gantt chart work for you, whether you create it in Excel, use an online template, or use a more advanced project management tool. Adjust it as your research progresses to meet the specific requirements of your project. As a result, you
Frequently asked questions
What is the dissertation gantt chart.
A Dissertation Gantt Chart is your visual roadmap to complete your dissertation. It breaks down the project into many parts like literature review, data collection, and writing chapters/topics. Each part has tasks with deadlines shown on a timeline, so always make the Gantt Chart before Writing a Dissertation.
How do I Create a Custom Gantt Chart?
To create a custom Gantt chart: Collect data: Arrange tasks, start/end dates, and durations of the single task which should be done in that time only. , Selecting a tool: Use Excel, Google Sheets, project management software tools, or any online tools with which you are comfortable and easy to use. , Customize: Change colors, and labels, and add details like key points and needs. , Refine: Confirm clarity and accuracy, and it should be easy to understand.
How to arrange a dissertation Gantt chart?
These tips helps you how to arrange a dissertation Gantt chart such as" Understand your timeline, Create task lists, Consider dependencies, Break down your dissertaion, Set deadlines, assign resources and visualize your chart".
What are the key points of a Gantt chart?
Here are some key points of a Gantt chart such as" Tasks, Timeline, Dependencies, Milestones, Critical Path, Progress and Resources allocation".
What are the 5 components of the Gantt Chart?
5 Components of a Gantt Chart are Task list, Timeline Duration, Dependencies and Resources allocation.
Loved reading this Blog? Share your valuable thoughts in the comment section.
Share Your Thought

Hi, I am Vipul Jain ( Founder of Workingment). I have contributed my writing expertise and collaborated with a team of experts to support UK students in achieving higher grades. My mission is to assist students who face various challenges in completing their academic writing projects.
Related Blogs

How To Critically Analyse A Research Paper: A Complete Checklist
A research paper is an academic piece of writing and is used to advance the knowledge and foundation to shape the academ ...

Politics Dissertation Topics and Titles For UK Students in 2024
Politics dissertation topics can be used for many other subjects as well, as these cover a variety of fields that are re ...

Finance & Accounting Dissertation Topics Ideas For UK Students in 2024
A finance & Accounting Dissertation comes in the list of most hectic subjects for a dissertation. When it comes to a ...

How To Write Declaration For Dissertation? Sample, Format & Guide
Declaration for dissertation and thesis is one important page that needs to be added in your dissertation, as this will ...

Best Midwifery Dissertation Topics, Ideas & Research Titles
Midwifery is the practice of providing care to women before and after giving birth to babies. Midwifery work does not en ...

Research Method vs Methodology: Difference, Meaning, Types, Objective and Aim, & How To Write
While researching to complete the dissertation, students might get confused between methods and methodology. Rese ...

List of Trending Economics Dissertation Topics and Titles For International Students
In today's world, the economy has become completely different. It is nothing like before in today's time this holds impo ...

Sociology Dissertation Topics, Ideas, Examples, Questions, Structure, Titles & Proposal
Let me guess you are here to get an understanding of your Sociology dissertation. First of all great choice of selecting ...

Dissertation Research Methods | Types & Examples
A Dissertation is an academic writing task provided by the University to the students in their final year of the degree. ...

How To Create Dissertation Table of Contents? MS Word, Sample, APA Format & Guide
While Writing a Dissertation or Thesis, students feel blank when it comes to creating a dissertation table of contents w ...

Workingment Appointment Call
In this 30-minute session, we’ll help you get started with Workingment, your trusted partner in assignment support.
We’ll showcase our platform, understand your academic goals, and answer all your questions to ensure our services align with your needs. Whether you’re looking for guidance on specific assignments, expert help across different subjects, or support in managing your academic workload, we’re here to make it easier for you to succeed.
Select a Date & Time
Get 100% ai & plagiarism free work, connect with our writers now.
Let's Book Your Work with Our Expert and Get High-Quality Content

This Website Uses Cookies We use cookies to enhance your experience on our website. Our updated privacy policy complies with GDPR regulations. By continuing to browse, you agree to our use of cookies, ensuring the best possible experience.
Select your style for Master thesis planning
- How it works
"Christmas Offer"
Terms & conditions.
As the Christmas season is upon us, we find ourselves reflecting on the past year and those who we have helped to shape their future. It’s been quite a year for us all! The end of the year brings no greater joy than the opportunity to express to you Christmas greetings and good wishes.
At this special time of year, Research Prospect brings joyful discount of 10% on all its services. May your Christmas and New Year be filled with joy.
We are looking back with appreciation for your loyalty and looking forward to moving into the New Year together.
"Claim this offer"
In unfamiliar and hard times, we have stuck by you. This Christmas, Research Prospect brings you all the joy with exciting discount of 10% on all its services.
Offer valid till 5-1-2024
We love being your partner in success. We know you have been working hard lately, take a break this holiday season to spend time with your loved ones while we make sure you succeed in your academics
Discount code: RP0996Y

Your content here...

Dissertation Gantt Chart – A Visual Way to Track your Dissertation Progress
Published by Ellie Cross at January 26th, 2023 , Revised On July 9, 2024
A dissertation Gantt chart is an essential tool for any student completing a doctoral degree. The chart helps you to organise and track your progress, ensuring that you complete your dissertation on time and with the required quality.
The Chart Includes the Following Key Elements:
- Title of the Dissertation
- Target Date for Completion
- Estimated Time to Complete (ETC)
- Actual Time to Complete (ACT)
- Changes Made to ETC or ACT from the Original Plan
- Summary of Major Accomplishments or Difficulties encountered during the project
Features of Gantt Chart
The following are the key features of a dissertation Gantt Chart:
- It has a timeline that shows the progress of the project.
- It contains tasks and deadlines for each phase of the project.
- It allows you to track resources and costs associated with the project.
- It provides an overview of how much work remains to be done in each project phase.
- It can help you to make informed decisions about when to take specific actions on the project.
How to Create a Custom Dissertation Gantt Chart?
When writing a dissertation , it is important to keep track of the progress and deadlines. One way to do this is to create a Gantt Chart. This guide will show you how to make a Gantt Chart for your dissertation.
- Decide what tasks need to be completed and when they need to be completed. The goal is to have everything on the chart in order by the deadline.
- Start by creating a table or graph to represent your project’s timeline. This will help you to easily see where tasks are located and how much time they will take.
- Next, add in each task’s duration (in hours and minutes), as well as the associated resources that will be needed for completion (e.g., research materials, software).
- Finally, allocate specific days and times for each step of your project based on the information in your timeline table. This will help you stay organised and on track!
- Assign each task a colour based on its importance. For example, green tasks should take less than an hour, and blue tasks should take more than an hour but at most two hours.
Gantt Chart Templates
There are many different Gantt Chart templates available online, so choosing one that best suits your needs is important.
Some popular templates include the Pareto chart and the Venn diagram. Both of these charts offer a variety of options for customisation, so you can create charts that look exactly the way you want them to. Additionally, both charts can easily be converted into graphs using GraphPad Prism.
If simplicity is key, then the line graph may be a better option. This chart offers minimal customisation options but allows you to clearly see trends and patterns in your data.
Hire an Expert Writer
Orders completed by our expert writers are
- Formally drafted in an academic style
- Free Amendments and 100% Plagiarism Free – or your money back!
- 100% Confidential and Timely Delivery!
- Free anti-plagiarism report
- Appreciated by thousands of clients. Check client reviews
The Importance of the Gantt Chart
Gantt charts are valuable as a student, and even if you are a university graduate, they can help you. Along with making good grades, as recommended by the university, you have to strive to take full advantage of the use of your projects. Brainstorming with your classmates can be a productive way to accomplish this objective. You need to use Gantt charts for your projects for several reasons.

It Helps Provide a Visual Outlook
A Gantt chart helps you handle your workflow by providing a detailed graphical representation. Gantt charts allow you to see all the tasks that must be completed, the amount of time needed, and task overlap. This will allow you to keep better track of goals and deadlines, which will be useful in ensuring you are on time to complete everything.
Solve Challenges Easily
A Gantt chart allows you to determine even better how to avoid issues and get the job done faster. You can see the result of the tasks that have been completed if you want to perceive the resources rightly to make the project run smoothly and quickly.
Evaluate Time
Effective task planning with the Gantt chart will help you organise and finish the projects efficiently. In addition, it will make it easier to see the actions you must complete before beginning others.
Ease of Communication
The Gantt chart will help you keep your group and sponsors notified of the modifications to your timetable. That’s why it’s crucial to have a regular update if your schedule changes. This means you can even use and provide available resources effectively.
Oversee a Project
The Gantt chart is crucial to the success of a project because that is how it assists in directing its activities through scheduling, assigning, and monitoring tasks. The horizontal chart makes it easy to see the projects’ progressions. You also always get to know what’s happening within any ongoing tasks.
Ease your Brain’s Memory
Gantt charts can help you reclaim your mind space by easing the selection of content you need to remember. Then, all you have to do is focus on accomplishing and acting on your current priorities. Team members can also see the course of the project’s tasks.
Reduces Cost
A Gantt chart is beneficial if you want to cut down on costs. Equipped with this, you can appreciate the tasks that have been carried out and stay up to date on what needs to be completed. As a result, you will remember essential deadlines and thus save more money on expenses.
The Benefits of Using a Dissertation Gantt Chart
No one knows the feeling of sitting in front of a blank whiteboard, trying to figure out how to write a dissertation . The process can seem daunting and overwhelming, but using a Gantt Chart can make the entire process much easier.
A Gantt Chart is simply a chart that helps you plan and track your tasks. It can be used for any project but is especially helpful when writing a dissertation. You can track your progress by breaking down your work into specific dates and tasks.
You will be able to see exactly where you are in progress. A Gantt Chart can provide a visual representation of your progress, which can help motivate you to complete your work on time.
Do you lack time and want someone to write your dissertation for you? Do you want to save money on your dissertation? Are you looking for someone to help with the grant chart process? Check out ResearchProspect! They can help you find the perfect person to create your dissertation.
You can trust these professionals to deliver top-notch work. Moreover, they offer affordable rates and a range of customisation options. So if you’re looking for an affordable and reliable writing service, look no further than ResearchProspect.
Frequently Asked Questions
What is dissertation gantt chart.
A dissertation Gantt Chart is a visual timeline or project management tool that outlines key research tasks, deadlines, and dependencies to help plan, track, and manage the progress of a dissertation project efficiently.
You May Also Like
Not familiar with how to proofread and edit your dissertation? Find out the best tips and do’s and don’ts of proofreading and editing a dissertation here.
Want to know, “Do college essay checkers check for an AI?”. Learn the reasons for checking AI, its benefits, and the use of the best essay checkers.
As Featured On

USEFUL LINKS
LEARNING RESOURCES

COMPANY DETAILS

Splash Sol LLC
- How It Works

How to write a Research Proposal: Creating a Gantt chart
- Components of a research proposal
- Useful videos
- Common mistakes to avoid
- Sage Research Methods LibGuide This link opens in a new window
- Managing sources
- Request a literature search
- Research proposal - examples
- Creating a Gantt chart
- Free Apps for Research
- Academic writing
What is a Gantt chart
Some University departments require students to create a Gantt chart to represent a schedule for the research project. The Gantt chart shows the timelines of the various steps of the project including their dependencies and any resources needed . In other words, the chart depicts when an event is supposed to take place in your project by providing an outline regarding the order in which the various tasks need to be performed .
An example of a Gantt chart.

Gantt chart on Moodle
How to create a Gantt chart - videos
- << Previous: Research proposal - examples
- Next: Free Apps for Research >>
- Last Updated: Sep 25, 2024 3:09 PM
- URL: https://libguides.unisa.ac.za/research_proposal
- Dissertation Proofreading and Editing
- Dissertation Service
- Dissertation Proposal Service
- Dissertation Chapter
- Dissertation Topic and Outline
- Statistical Analysis Services
- Model Answers and Exam Notes
- Dissertation Samples
- Essay Writing Service
- Assignment Service
- Report Service
- Coursework Service
- Literature Review Service
- Reflective Report Service
- Presentation Service
- Poster Service
- Criminal Psychology Dissertation Topics | List of Trending Ideas With Research Aims
- Cognitive Psychology Dissertation Topics | 10 Top Ideas For Research in 2025
- Social Psychology Dissertation Topics | 10 Latest Research Ideas
- Top 10 Clinical Psychology Dissertation Topics with Research Aims
- Educational Psychology Dissertation Topics | 10 Interesting Ideas For Research
- Customer Service Dissertation Topics | List of Latest Ideas For Students
- 15 Interesting Music Dissertation Topics
- Business Intelligence Dissertation Topics | List of Top Ideas With Research Aims
- Physical Education Dissertation Topics | 15 Interesting Title Examples
- 15 Top Forensic Science Dissertation Topics with Research Aims
- Islamic Finance Dissertation Topics | List of 15 Top Ideas With Research Aims
- Dissertation Examples
- Dissertation Proposal Examples
- Essay Examples
- Report Examples
- Coursework Examples
- Assignment Examples
- Literature Review Examples
- Dissertation Topic and Outline Examples
- Dissertation Chapter Examples
- Dissertation Help
- Dissertation Topics
- Academic Library
- Assignment Plagiarism Checker
- Coursework Plagiarism Checke
- Dissertation Plagiarism Checker
- Thesis Plagiarism Checker
- Report Plagiarism Checke
- Plagiarism Remover Service
- Plagiarism Checker Free Service
- Turnitin Plagiarism Checker Free Service
- Free Plagiarism Checker for Students
- Difference Between Paraphrasing & Plagiarism
- Free Similarity Checker
- How Plagiarism Checkers Work?
- How to Cite Sources to Avoid Plagiarism?
- Free Topics
- Get a Free Quote

- Report Generating Service
- Model Answers and Exam Notes Writing
- Reflective or Personal Report Writing
- Poster Writing
- Literature Review Writing
- Premier Sample Dissertations
- Course Work
- Cognitive Psychology Dissertation Topics
- Physical Education Dissertation Topics
- 15 Top Forensic Science Dissertation Topics
- Top 10 Clinical Psychology Dissertation Topics
- Islamic Finance Dissertation Topics
- Social Psychology Dissertation Topics
- Educational Psychology Dissertation Topics
- Business Intelligence Dissertation Topics
- Customer Service Dissertation Topics
- Criminal Psychology Dissertation Topics

- Literature Review Example
- Report Example
- Topic and Outline Examples
- Coursework Example

- Coursework Plagiarism Checker
- Turnitin Plagiarism Checker
- Paraphrasing and Plagiarism
- Best Dissertation Plagiarism Checker
- Report Plagiarism Checker
- Similarity Checker
- Plagiarism Checker Free
- FREE Topics
Get an experienced writer start working
Review our examples before placing an order, trusted by 20,000+ happy students, dissertation gantt chart | guide & templates.

PsyD vs PhD in Clinical Psychology: Key Differences and Similarities

Crafting Effective APA Format Paragraphs: Guidelines & Examples

Planning your dissertation can feel like time has sprouted wings and taken off without you. Fear not, for the trusty companion of the dissertation, Gantt Chart is here to rescue you from the chaos of research, writing tasks, and impending deadlines.
Learn Crafting a Captivating Discussion in an Academic Report
A Complete Guide: How to Write a Research Design
In this article, we will explore the world of Gantt charts, demystify their purpose, and explore how to create a Gantt Chart. You can find here a dissertation Gantt chart guide with steps for creating the chart, a template and tips to help you create your own chart.
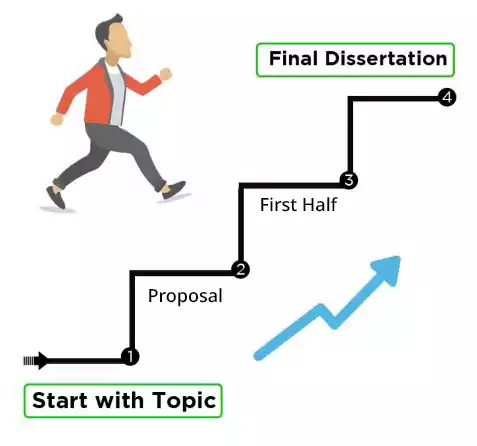
3-Step Dissertation Process!

Get 3+ Topics

Dissertation Proposal

Get Final Dissertation
What is dissertation gantt chart.
“A Gantt chart for dissertation is a visual representation of the tasks and milestones in completing a dissertation. It is a useful tool for planning and tracking your progress and can help you to stay on track and avoid procrastination.”
The Gantt Chart provides a dissertation timeline and guiding light amidst the foggy labyrinth of academic pursuits. It's a visual representation of the researcher or student project's timeline, providing a clear picture of the tasks that need to conquer. Remember, Rome wasn't built in a day, and neither will any dissertation be. But with a well-crafted Gantt chart, a researcher breaks down their work into manageable chunks and tackles them systematically.
Creating a Dissertation Gantt Chart: Steps to Follow
Here are the steps on how to create a dissertation Gantt chart;
- Conduct a literature review on the topic of social media and teenagers.
- Collect data on how teenagers use social media.
- Analyze the data and write a report on your findings.
- Write your dissertation.
- Estimate the time it will take to complete each task. This will help you to create a realistic timeline for your dissertation. Be sure to factor in time for unexpected delays, such as data collection taking longer than expected or having to revise your dissertation after your advisor provides feedback.
- Create a Gantt chart. There are many different software programs that you can use to create a Gantt chart, like Google Sheets, WPS sheets and more. Once you have created your chart, you can add the tasks, their estimated time frames, and any other relevant information.
- Track your progress. As you make progress on your dissertation, be sure to update your Gantt chart to reflect your progress. This will help you to stay on track and identify any areas where you might be falling behind.
- Adjust your plan as needed. Things don't always go according to plan, so it's important to be flexible and adjust your plan as needed. For example, if you find that you are spending more time on one task than you expected, you might need to adjust the time frame for other tasks.
Using a dissertation Gantt chart is a helpful way to stay on track and avoid procrastination. It also helps you to identify areas where you can improve your efficiency.
Here are a few things you don't have to worry about;
Not being afraid to change your Gantt chart as needed
Don't forget to add important comment in case of delay or over time
Neglecting unwanted commitments
How Does It Work ?
Fill the Form
Please fill the free topic form and share your requirements
Writer Starts Working
The writer starts to find a topic for you (based on your requirements)
3+ Topics Emailed!
The writer shared custom topics with you within 24 hours
Dissertation Gantt Chart Template
Here is a Gantt chart template for dissertation that help researchers and student to craft their own chart to achieve their goals.
This template is general that doesn’t stick to any research. Also, every dissertation or research report has its time to completion. The dissertations for graduation, master's, and PhD are often required to be completed in a different timeframe, with a different research style and methodology. Here is an example of PhD Gantt Chart ;
This Gantt chart provides a high-level overview of the dissertation timeline involved in a PhD program. It is important to break down your program into smaller, more manageable tasks. This will make it easier to track your progress and make adjustments to your timeline as needed.
It is also important to build in some buffer time between tasks. This will allow for unexpected delays, such as difficulty finding sources, equipment failure, or illness.
Finally, be sure to track your progress and make adjustments to your Gantt chart as needed. This will help you stay on track and avoid falling behind.
Additional Tips for Dissertation Gantt Chart
Here are some additional tips for using a dissertation Gantt chart:
- Use a software program to create your Gantt chart. There are many different software programs that you can use to create a Gantt chart. Some popular options include Microsoft Excel, Google Sheets, and Trello.
- Make your Gantt chart visual. Use colors, fonts, and symbols to make your Gantt chart easy to read and understand.
- Share your Gantt chart with others. This can help you to stay accountable and get feedback from others.
- Don't be afraid to adjust your Gantt chart as needed. Things don't always go according to plan, so it's important to be flexible and adjust your Gantt chart as needed.
Conclusion
A Gantt chart is an indispensable tool, akin to a trusty compass guiding you through uncharted waters. It helps you break down your work into manageable chunks, consider dependencies, and maintain flexibility. By embracing the power of this visual aid, you'll be able to navigate the daunting dissertation journey with confidence. So, let the Dissertation Gantt Chart be your co-pilot, ensuring that time flies not in vain but in harmony with your research and writing goals.
Get an Immediate Response
Discuss your requirements with our writers
WhatsApp Us Email Us Chat with Us
Get 3+ Free Dissertation Topics within 24 hours?
Your Number
Academic Level Select Academic Level Undergraduate Masters PhD
Area of Research
admin farhan
Related posts.

Dissertation Interview Questions | Everything You Need To Know

Conducting Interviews for Your Dissertation | A Comprehensive Guide

What is Gibbs’ Reflective Cycle and How Can It Benefit You? | Applications and Example
Comments are closed.
FREE Chart Templates
Create Professional Chart Designs Online with Template.net’s Free Chart Templates That You Can Customize, Edit, and Print. Choose from Editable Samples to Customize Titles, Diagrams, Data, Colors, Logos, and Text.
- Hierarchy Organizational Chart
- Tree Organizational Chart
- Organization Chart
- Chore Chart
- Blood Pressure Chart
- Charts Behavior
- Process Flowchart
- Process Flow Chart
- Color Chart
- Time Table Chart
- Baby Feeding Chart
- Ring Size Chart
- Height Chart
- Number Chart
- Baby Milestones Chart
- Blood Sugar Chart
- Chart Template in Word
- Chart Template in Google Docs
- Chart Template in Excel
- Chart Format Template in Excel
- Chart Template in PDF
- Chart Template in Google Sheets
- Chart Template in Illustrator, Vector, Image
- Chart Template in PSD
- Chart Template in Apple Pages, Imac
- Chart Template in PPT
- Department Chart Template in PPT
- Company Organizational Chart Template in PPT
- Chart Template in Publisher
- Chart Template in Google Slide
- Chart Template in InDesign
- Chart Template in Apple Number, Imac
- Chart Template in Apple Keynote, Imac
Chart Template
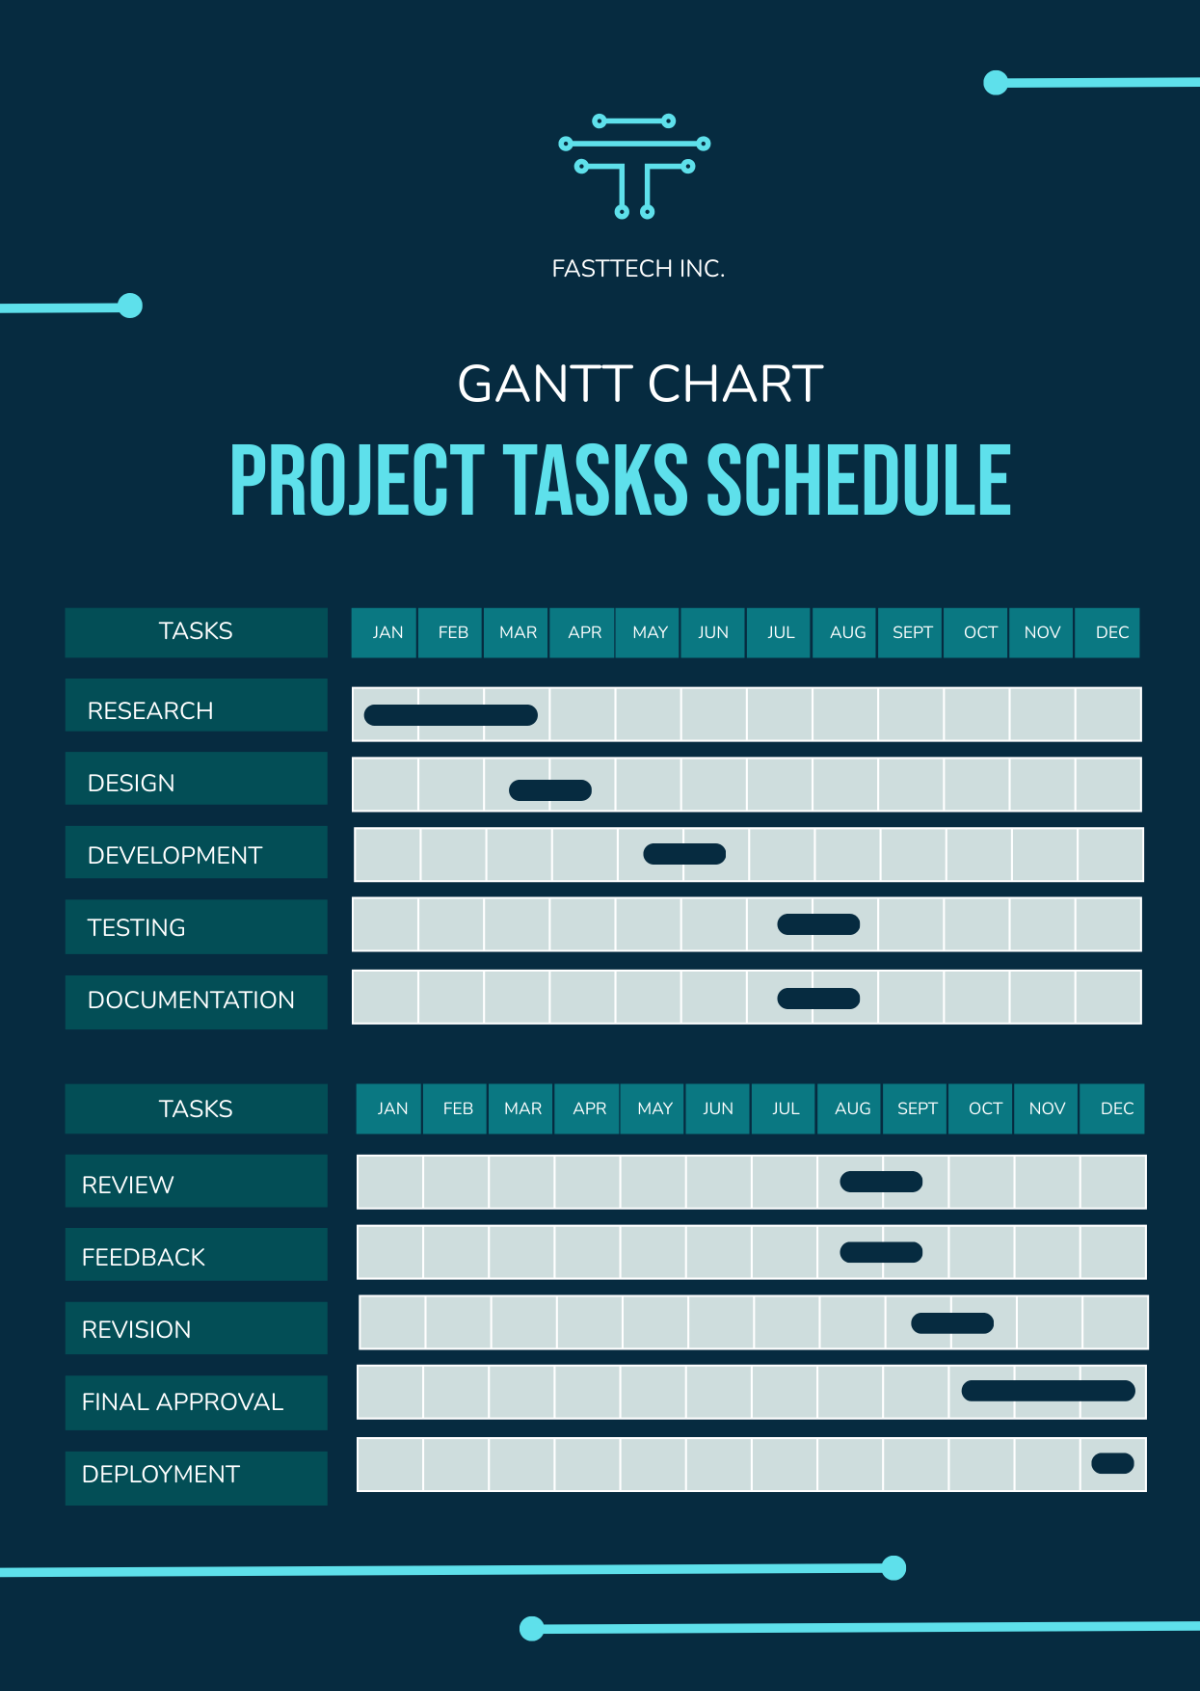
Gantt Chart Templates
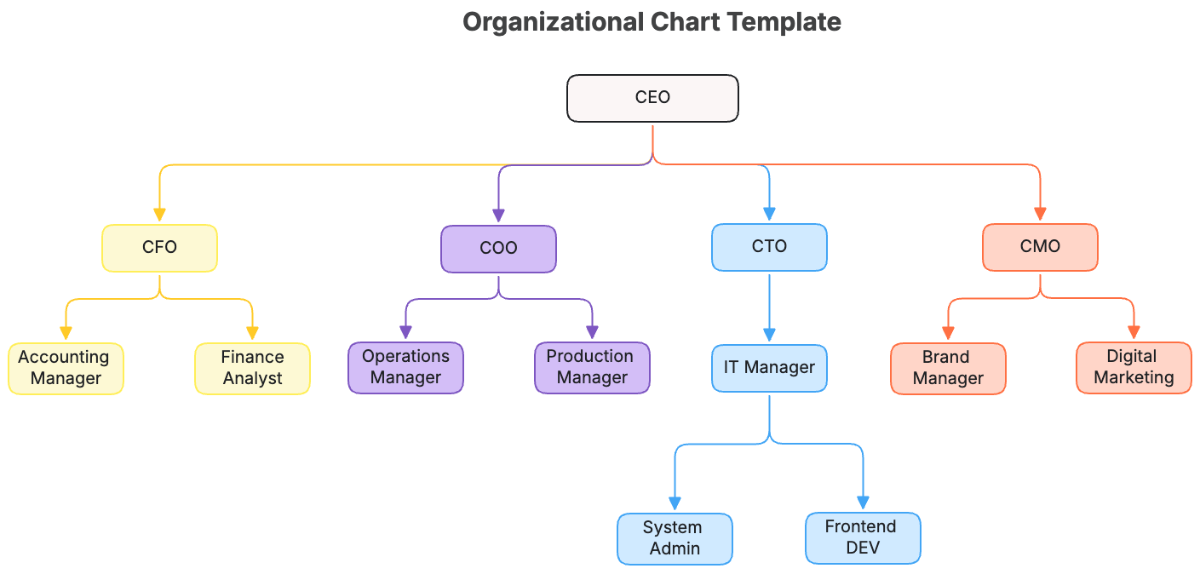
Organizational Chart Template
Printable Chart Template
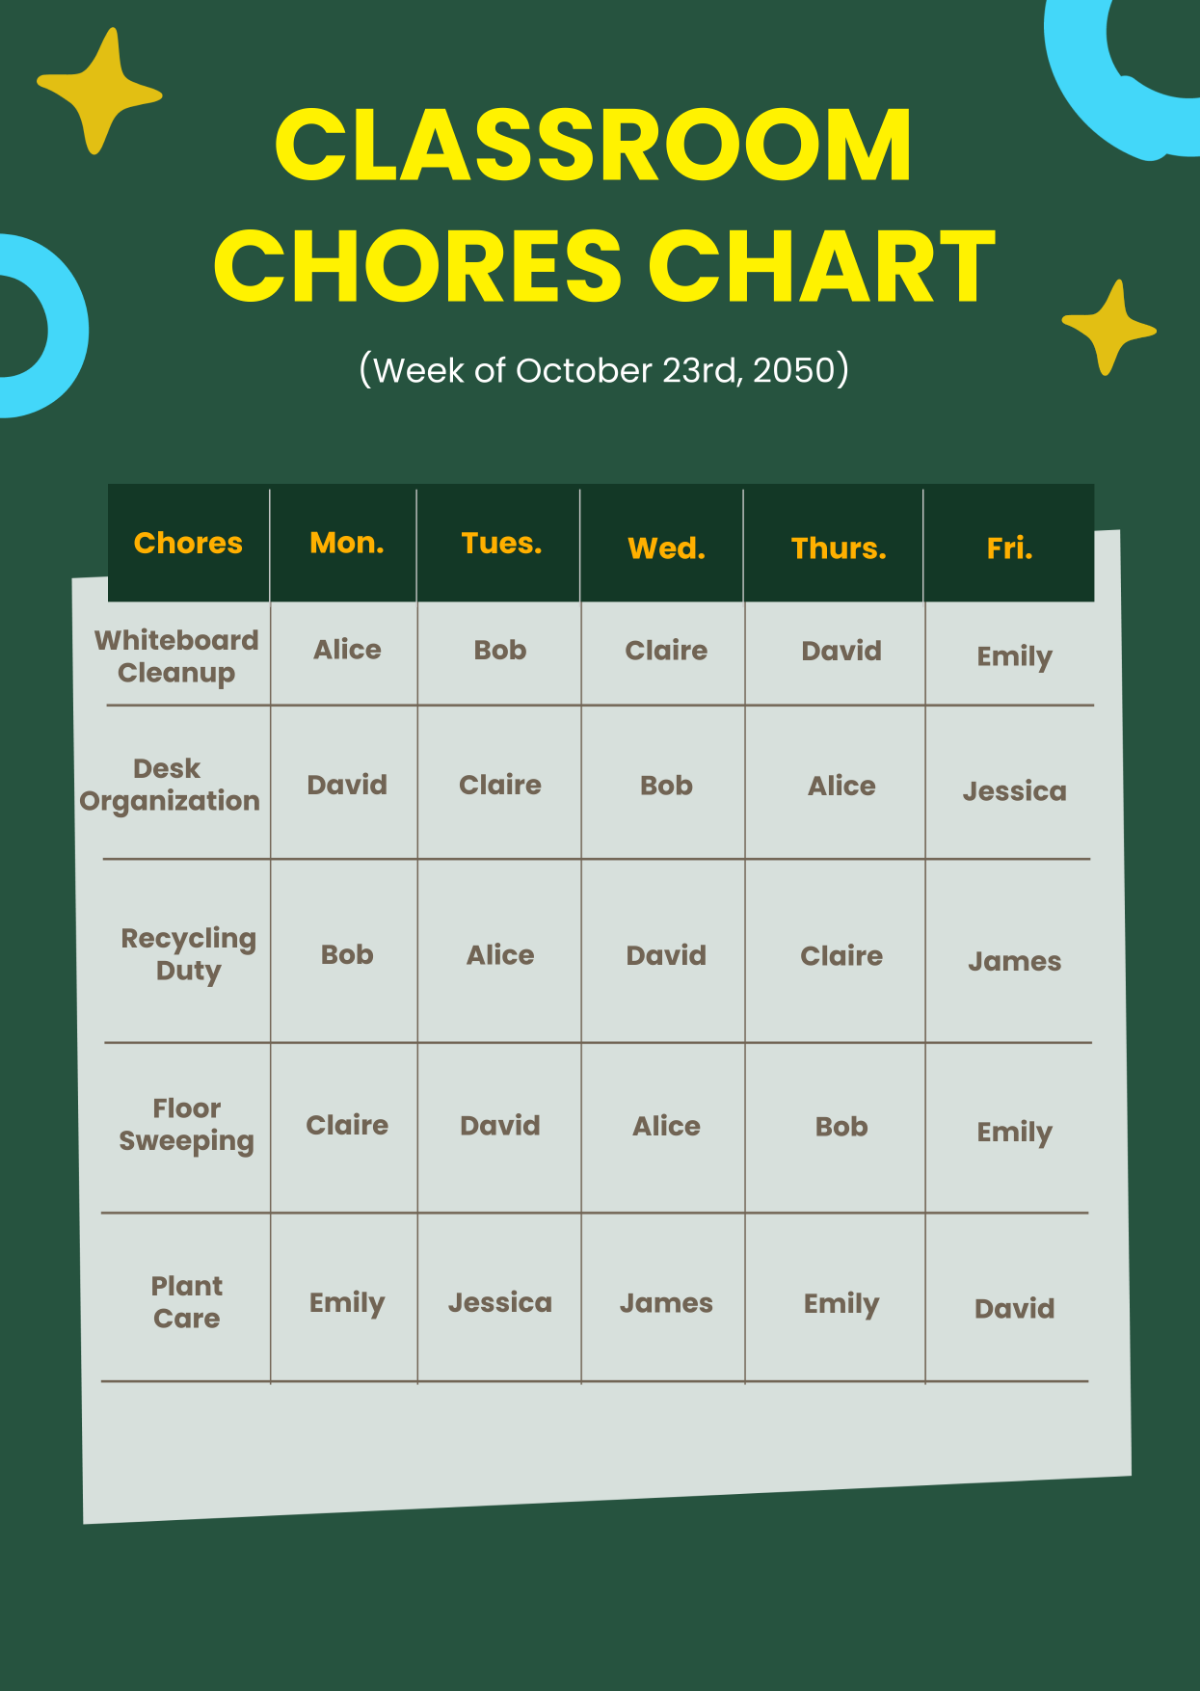
Simple Chart Template

Reward Chart Template
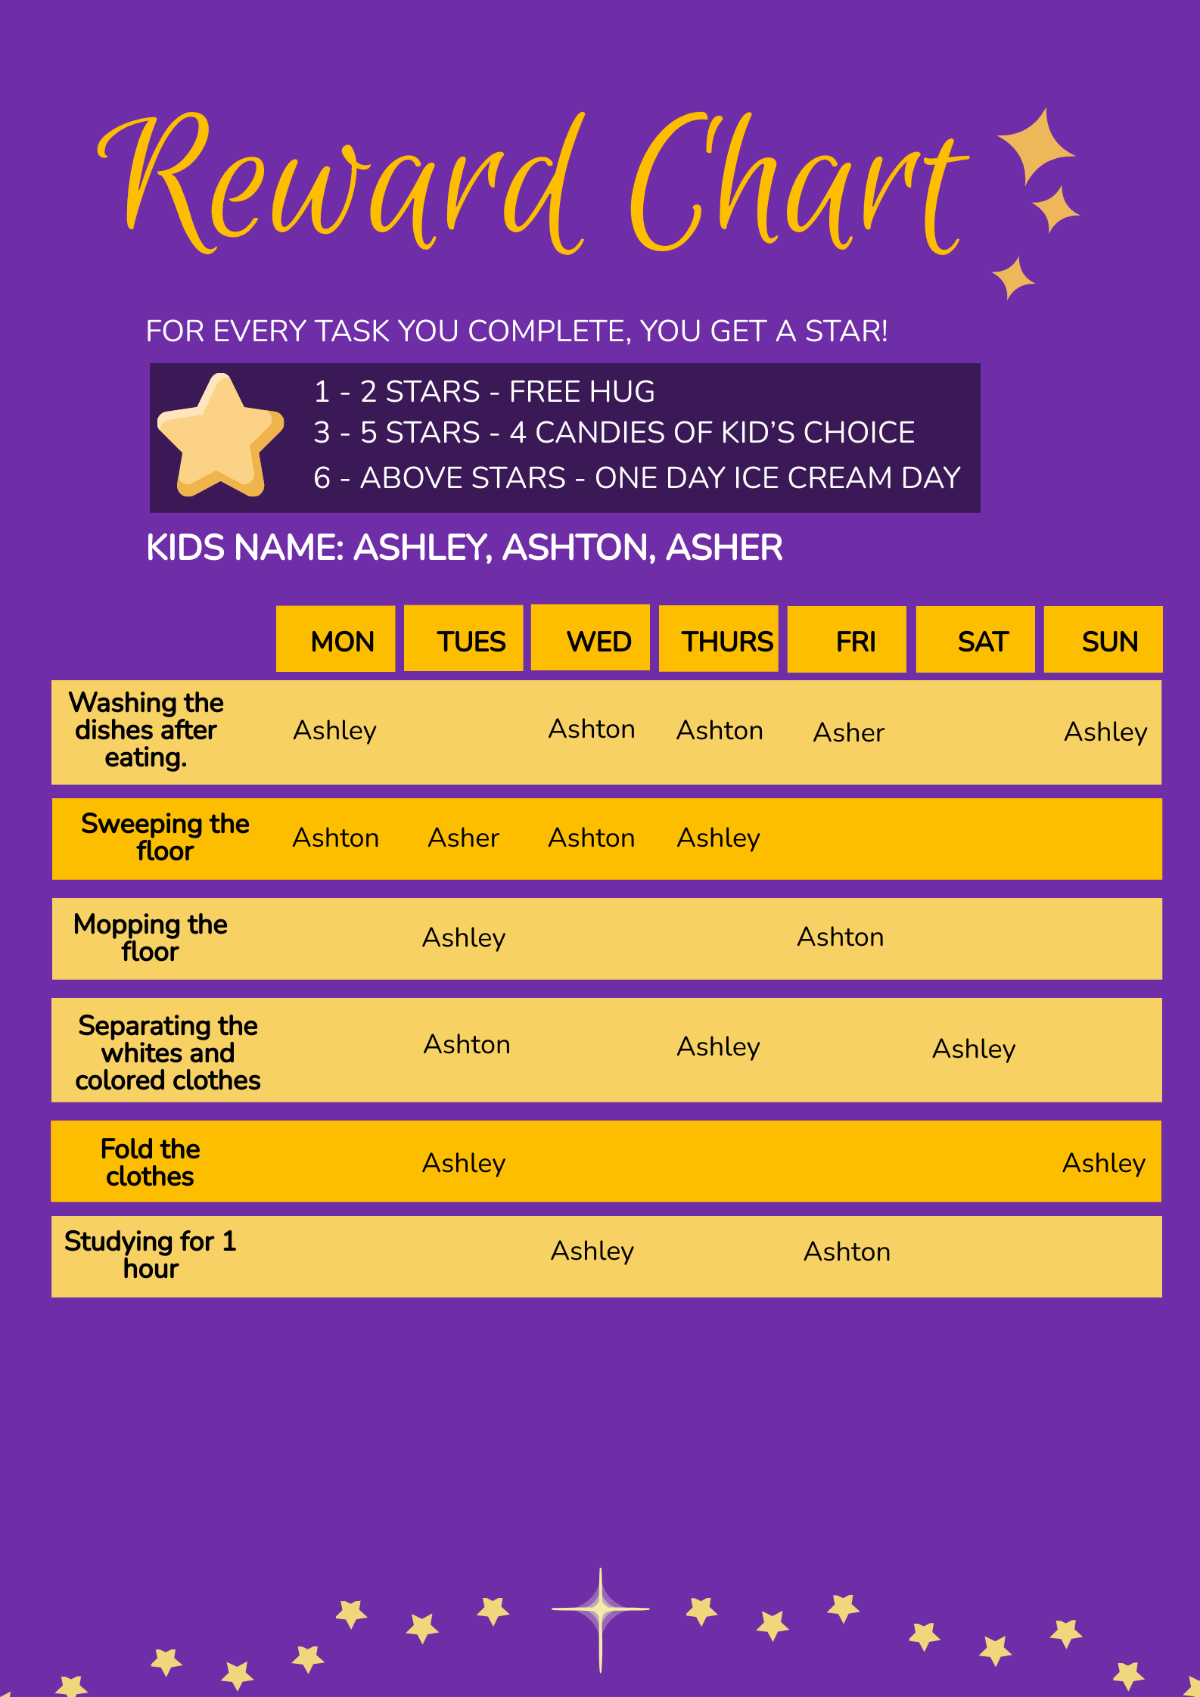
Circle Chart Template
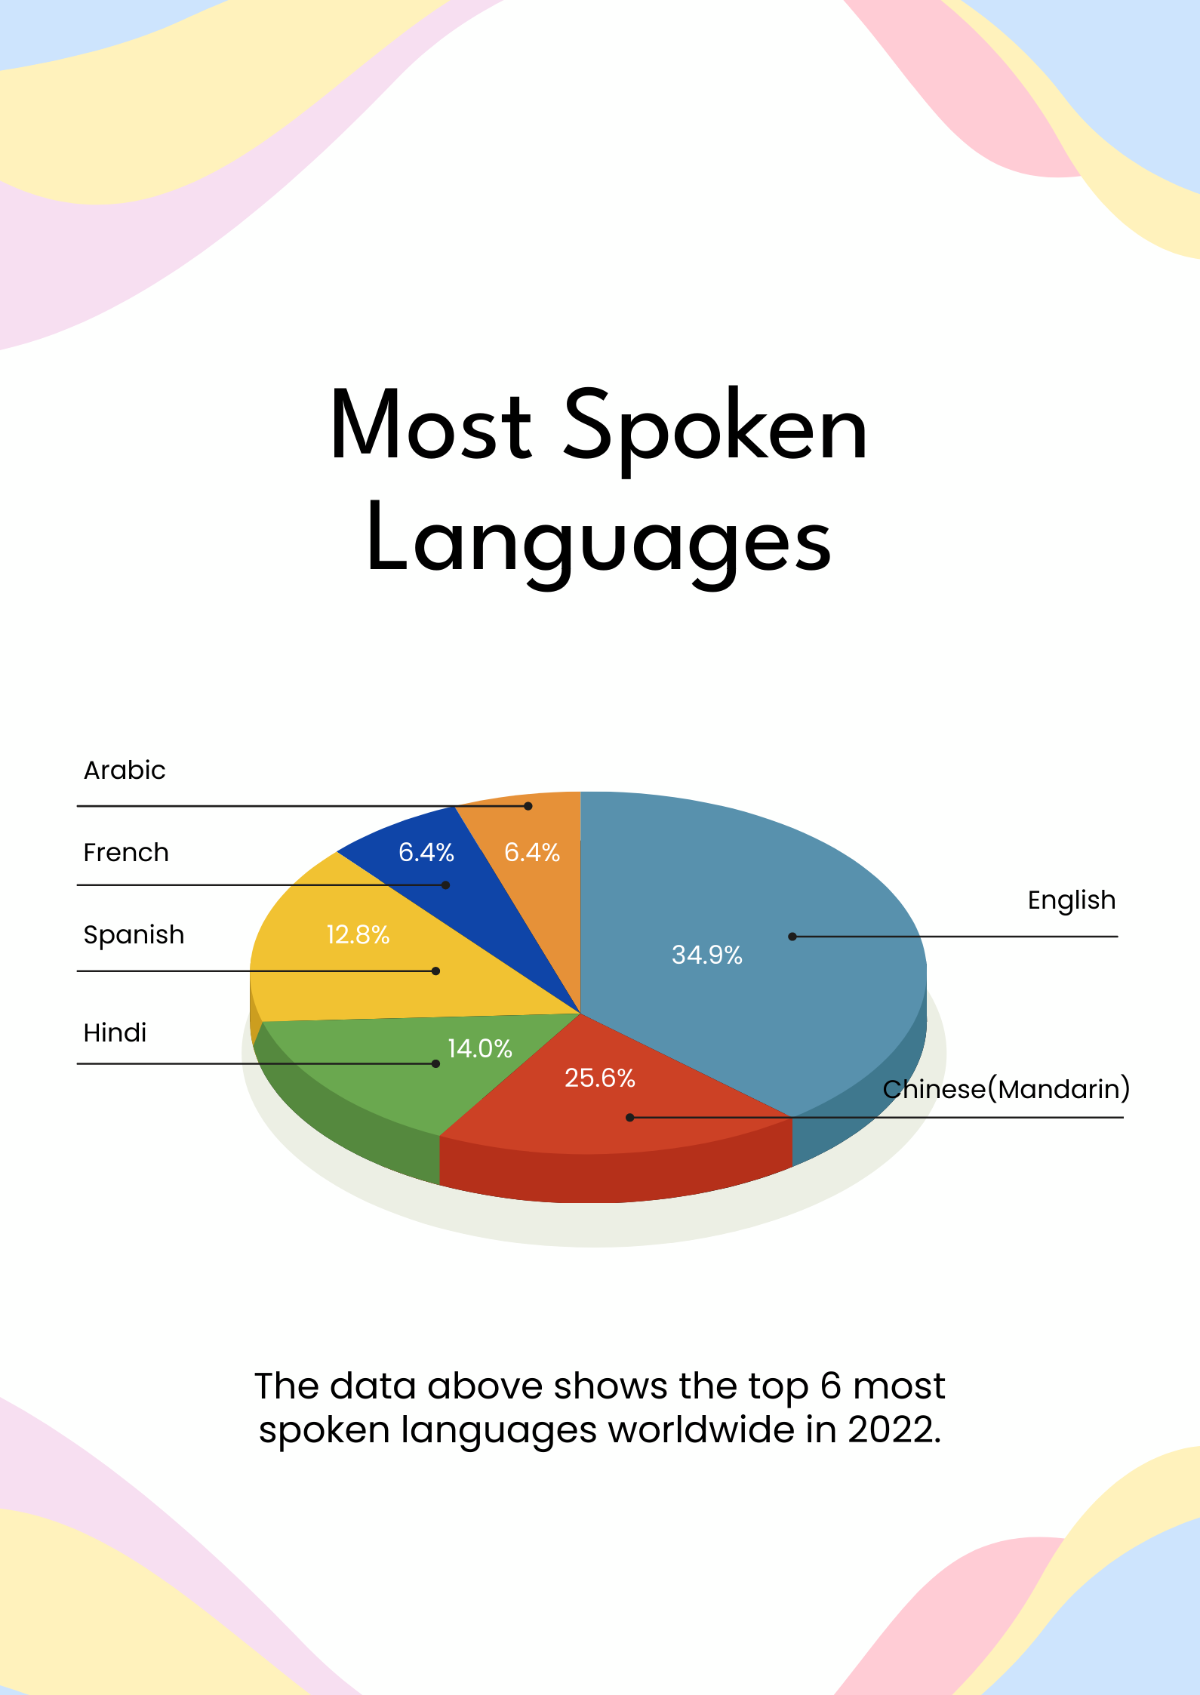
Creative Line Chart Template
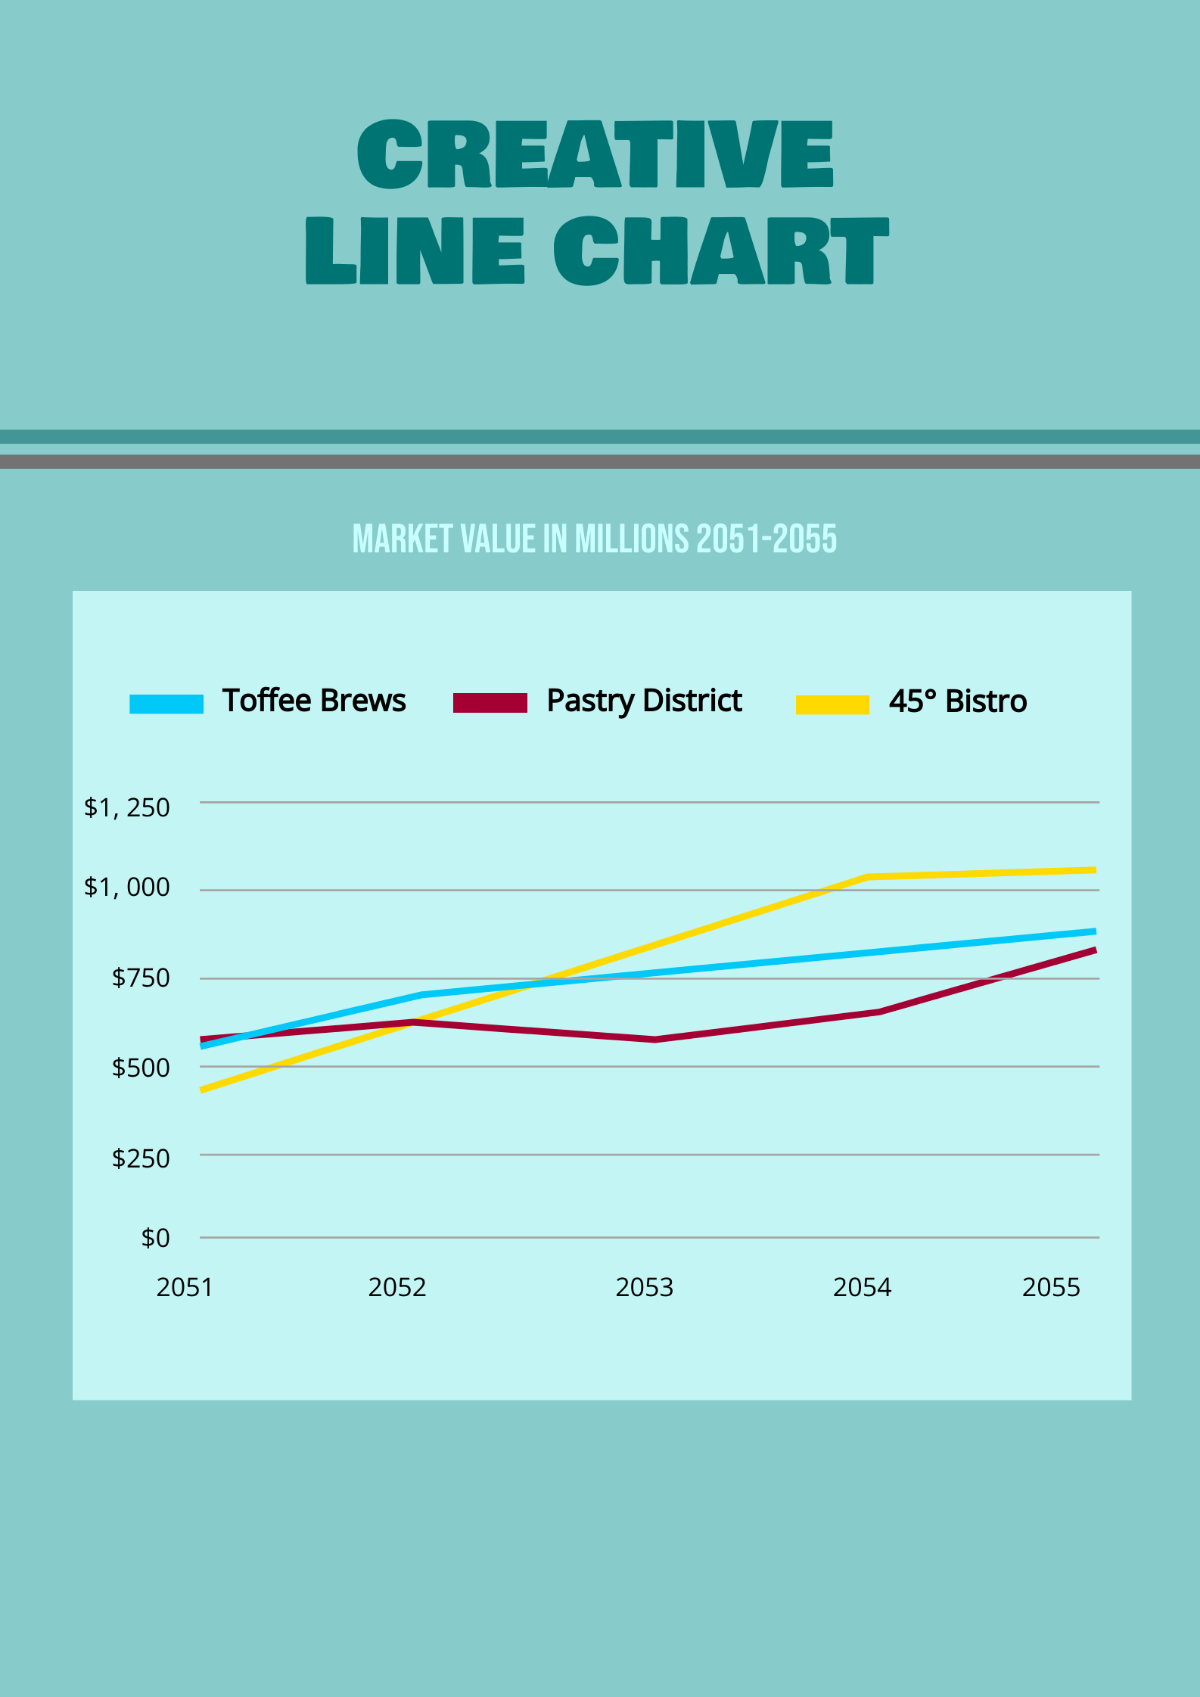
Timeline Chart Template
Area Chart Templates
Business Chart Template
Chore Chart Template
Weekly Chart Template
Comparison Bar Chart Template
Cumulative Growth Bar Chart Template
Director Organizational Chart Template
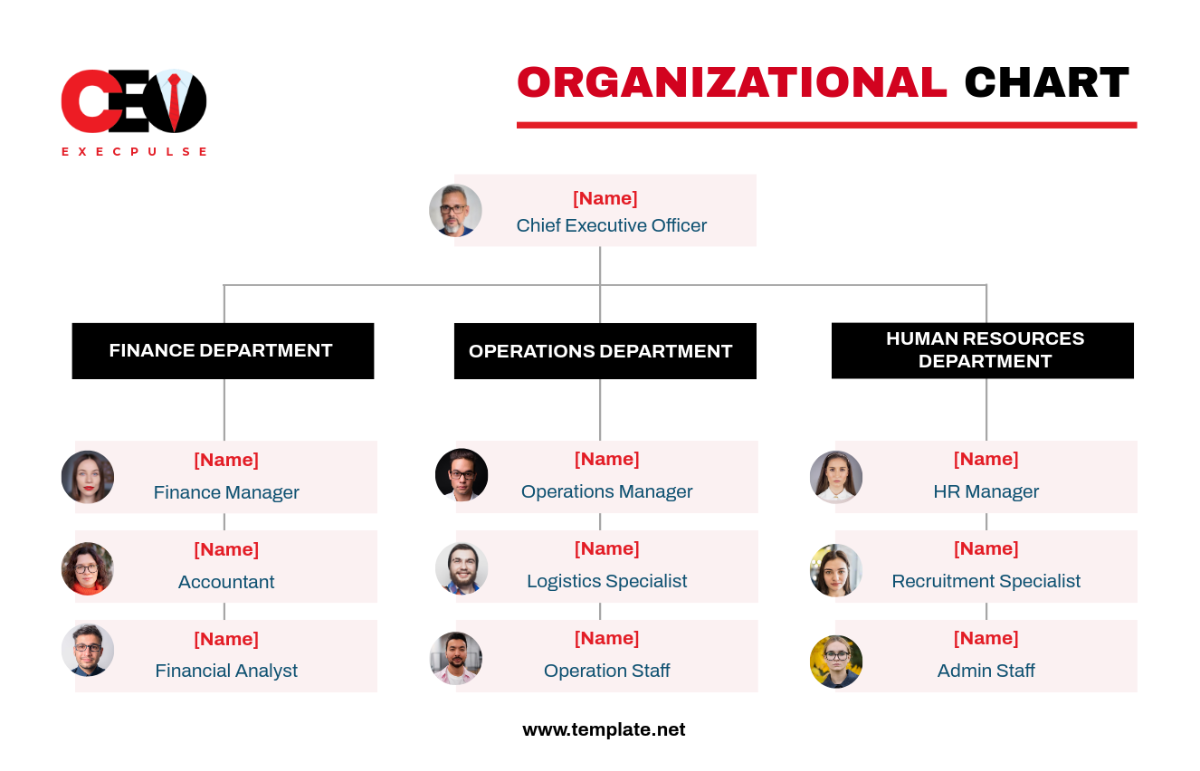
CEO Organizational Chart Template
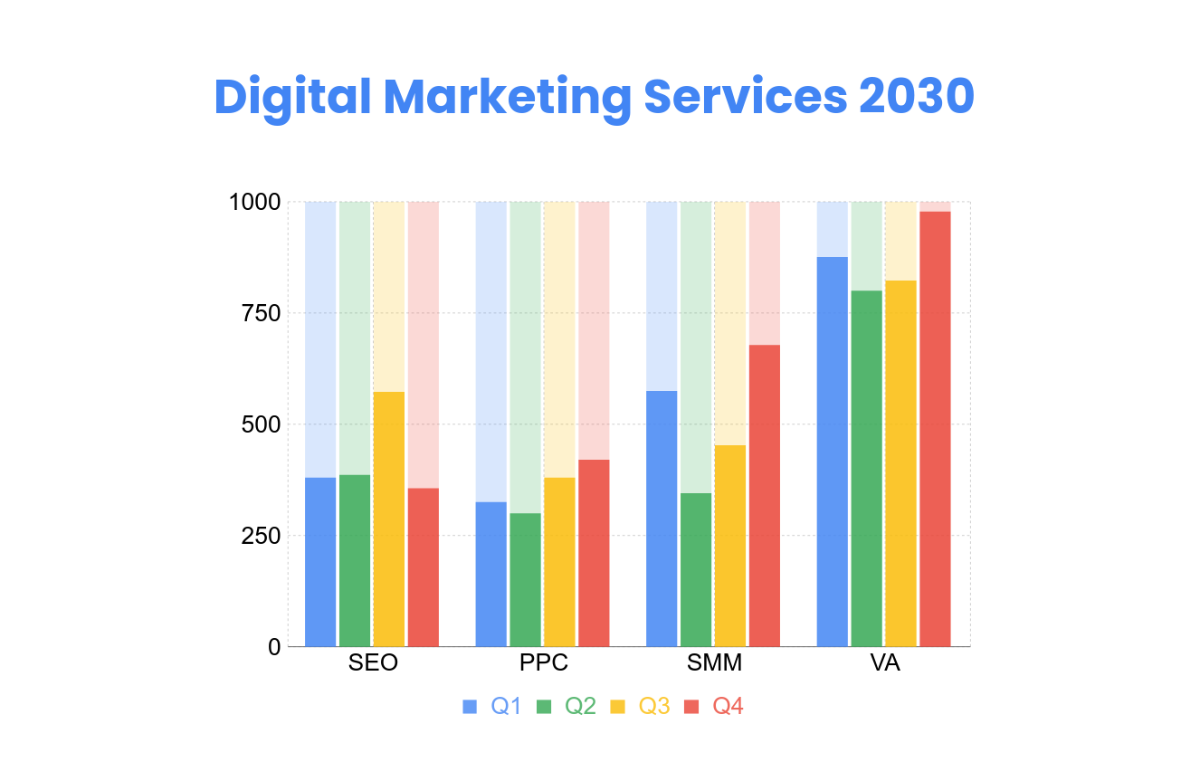
Marketing Analysis Bar Chart Template
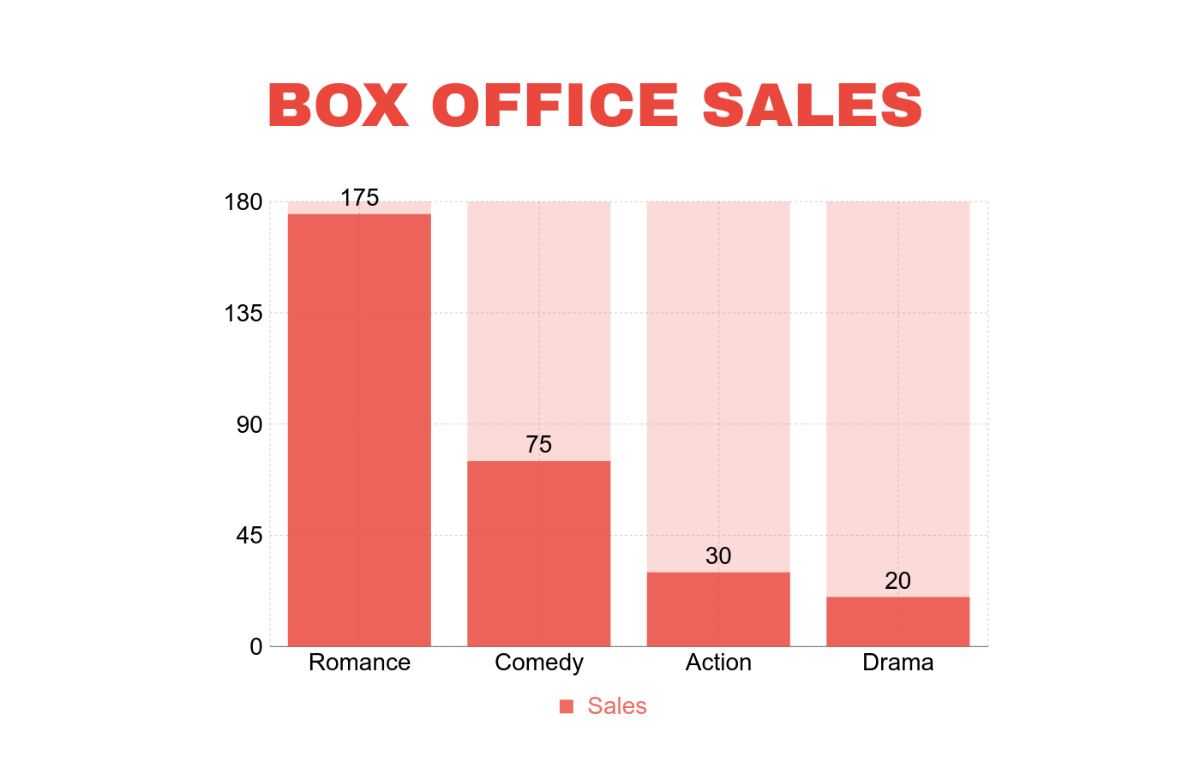
Sales Bar Chart Template
Multiple Bar Chart Template
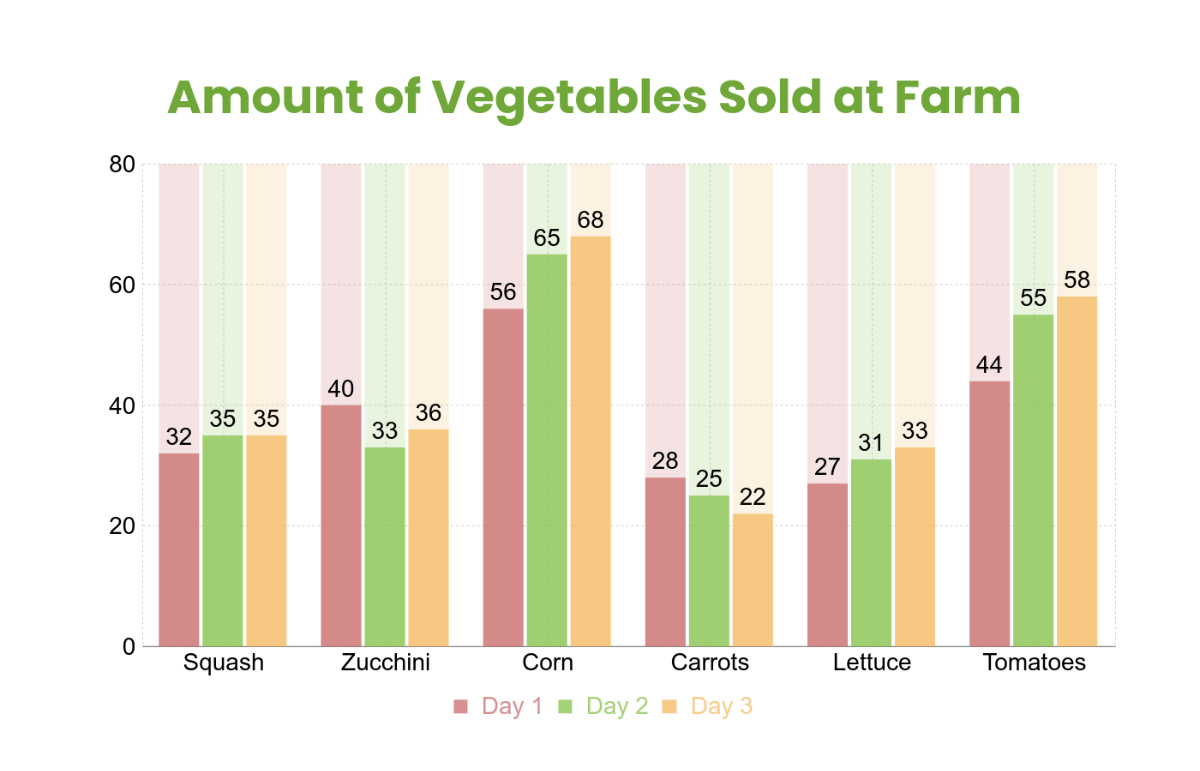
Bar Chart Templates
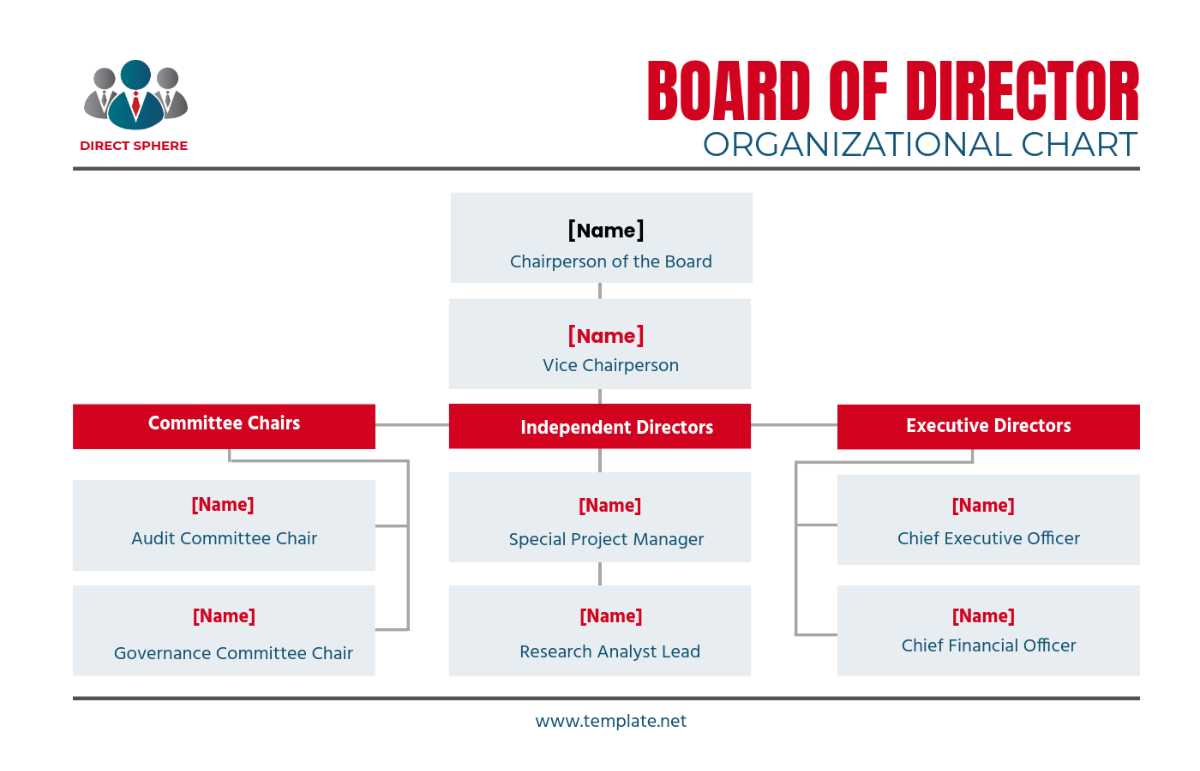
Board of Director Organizational Chart Template
National Dentist's Day Banner Template

National Dentist's Day Website Banner Template

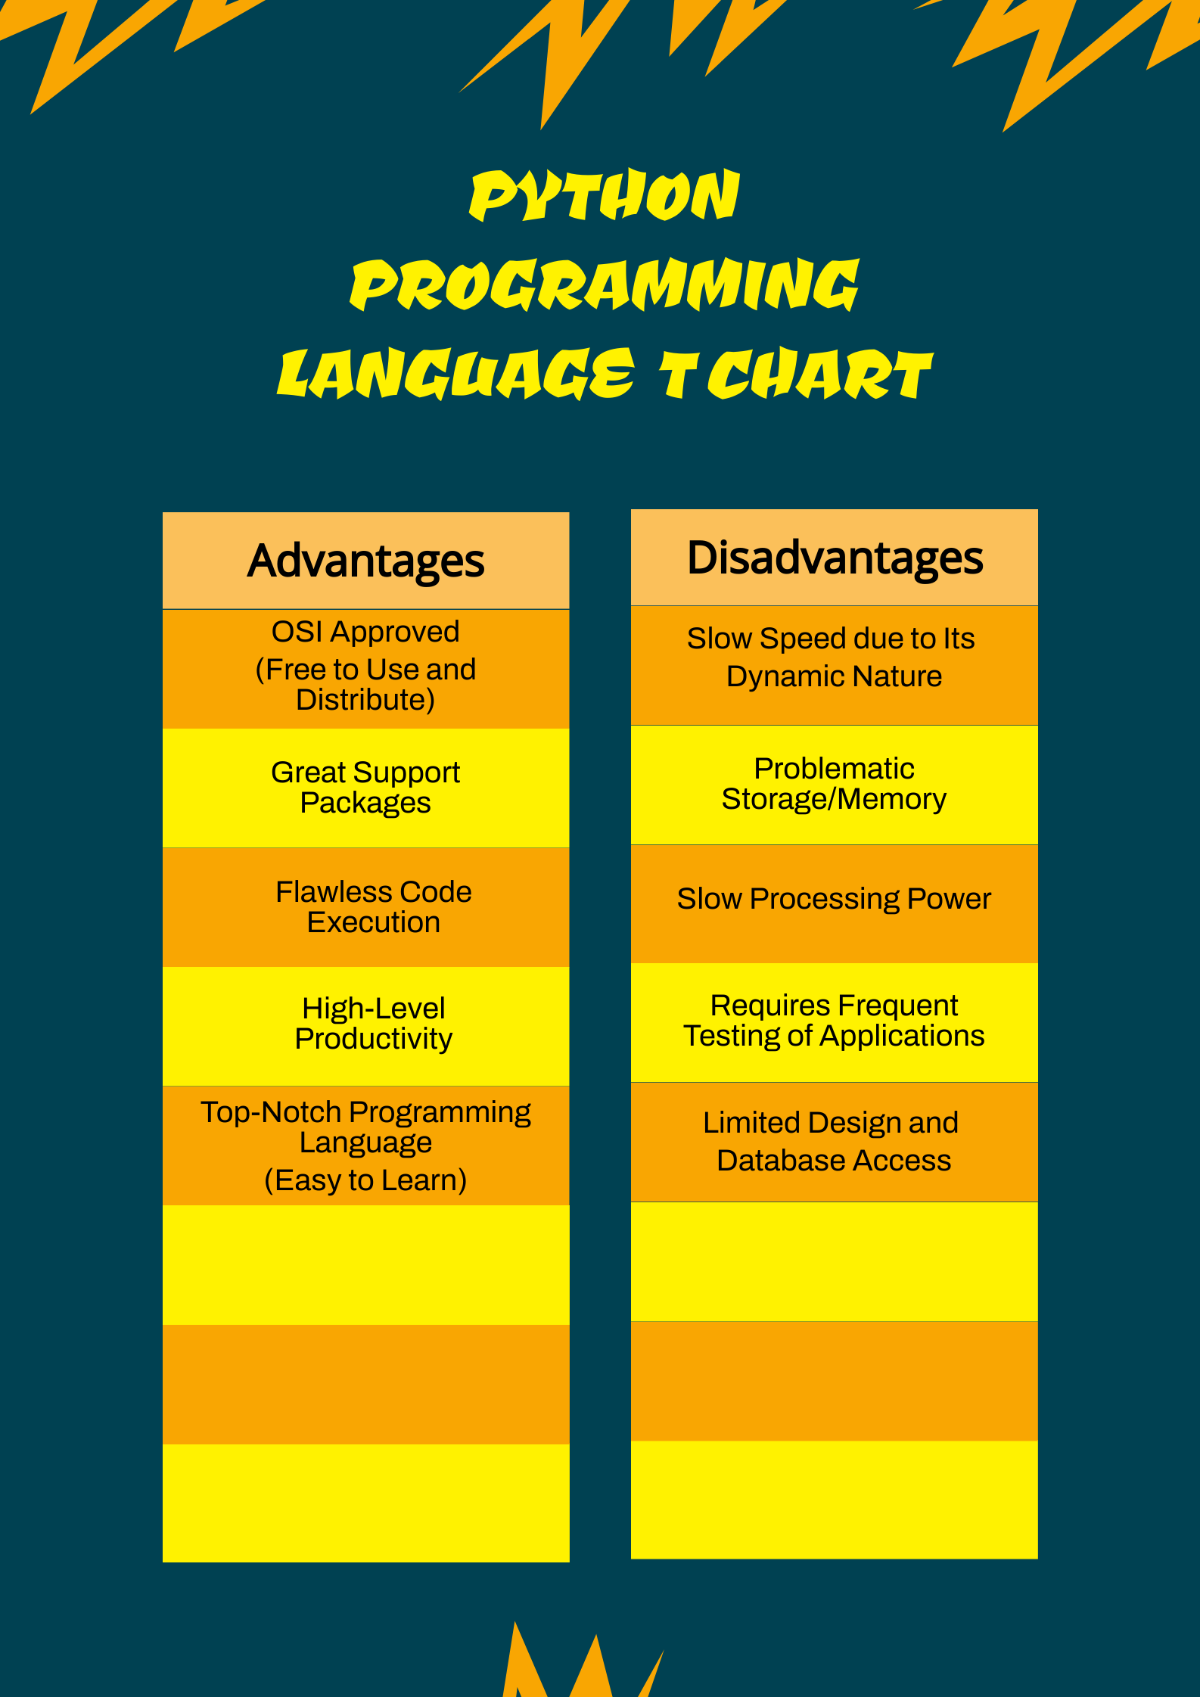
Python Programming Language T Chart Template
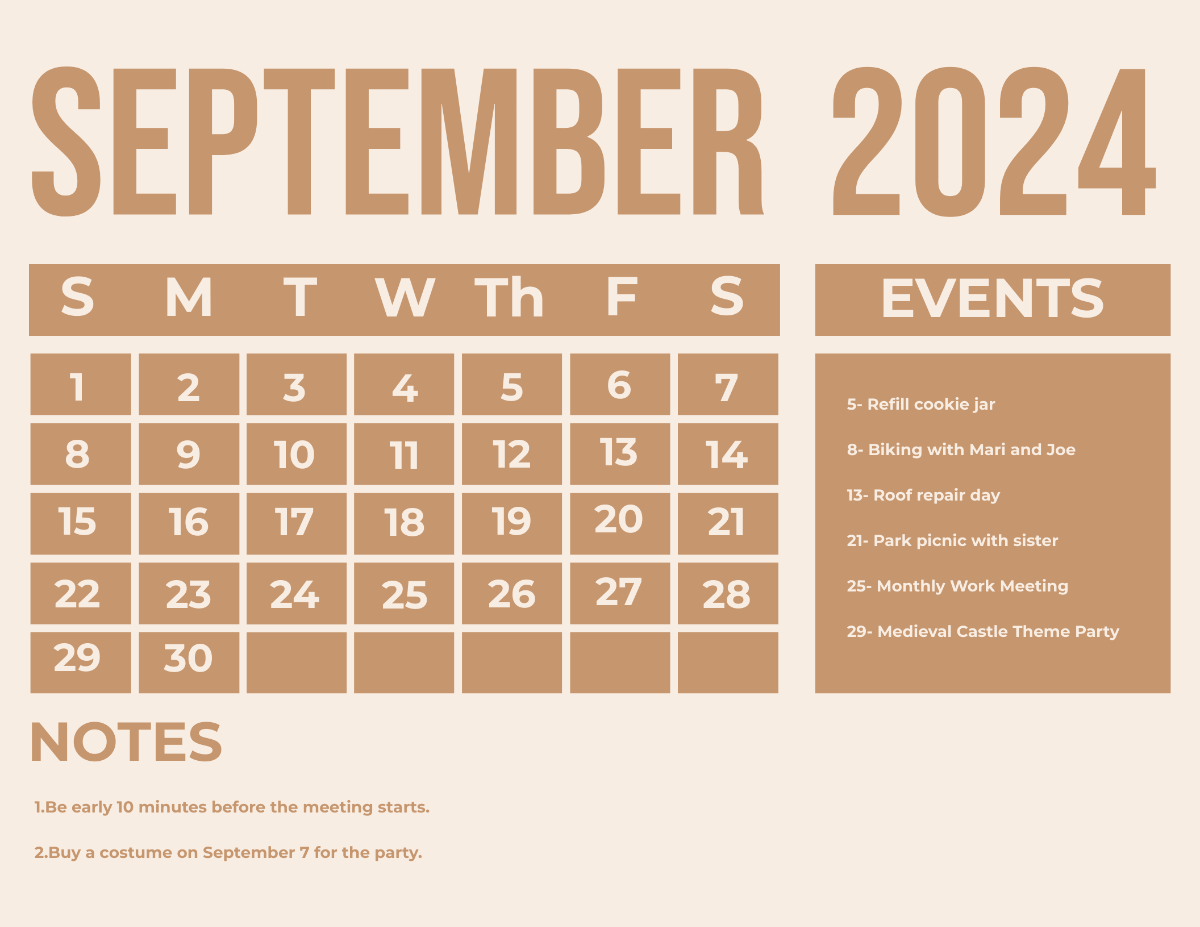
September 2024 Calendar Template
Color Mixing Cards & Chart Template
Tarot Card Reference Template
Tarot Monthly Card Tracker Sheet Template
Time Card Conversion Chart Template
Behavior Punch Card Template
Weekly Chore Chart Planner Template
Obesity Awareness Poster Template

B2B Flow Chart Template
B2B Organizational Chart Template
Auction Item Comparison Chart Template
Boxing Day Wishes Vector Template

Vector CMY Color Chart Template
Music Keyboard Vector Template
Good Friday Symbol Vector Template

Diabetic Dairy Chart Template
Global Warming Infographic Template

Crypto Chart Template
Diabetes Prevention Chart Template
Colorful Hello Kitty Chore Chart Template
Birth Chart Template
Go-to-Market Sales Funnel Template
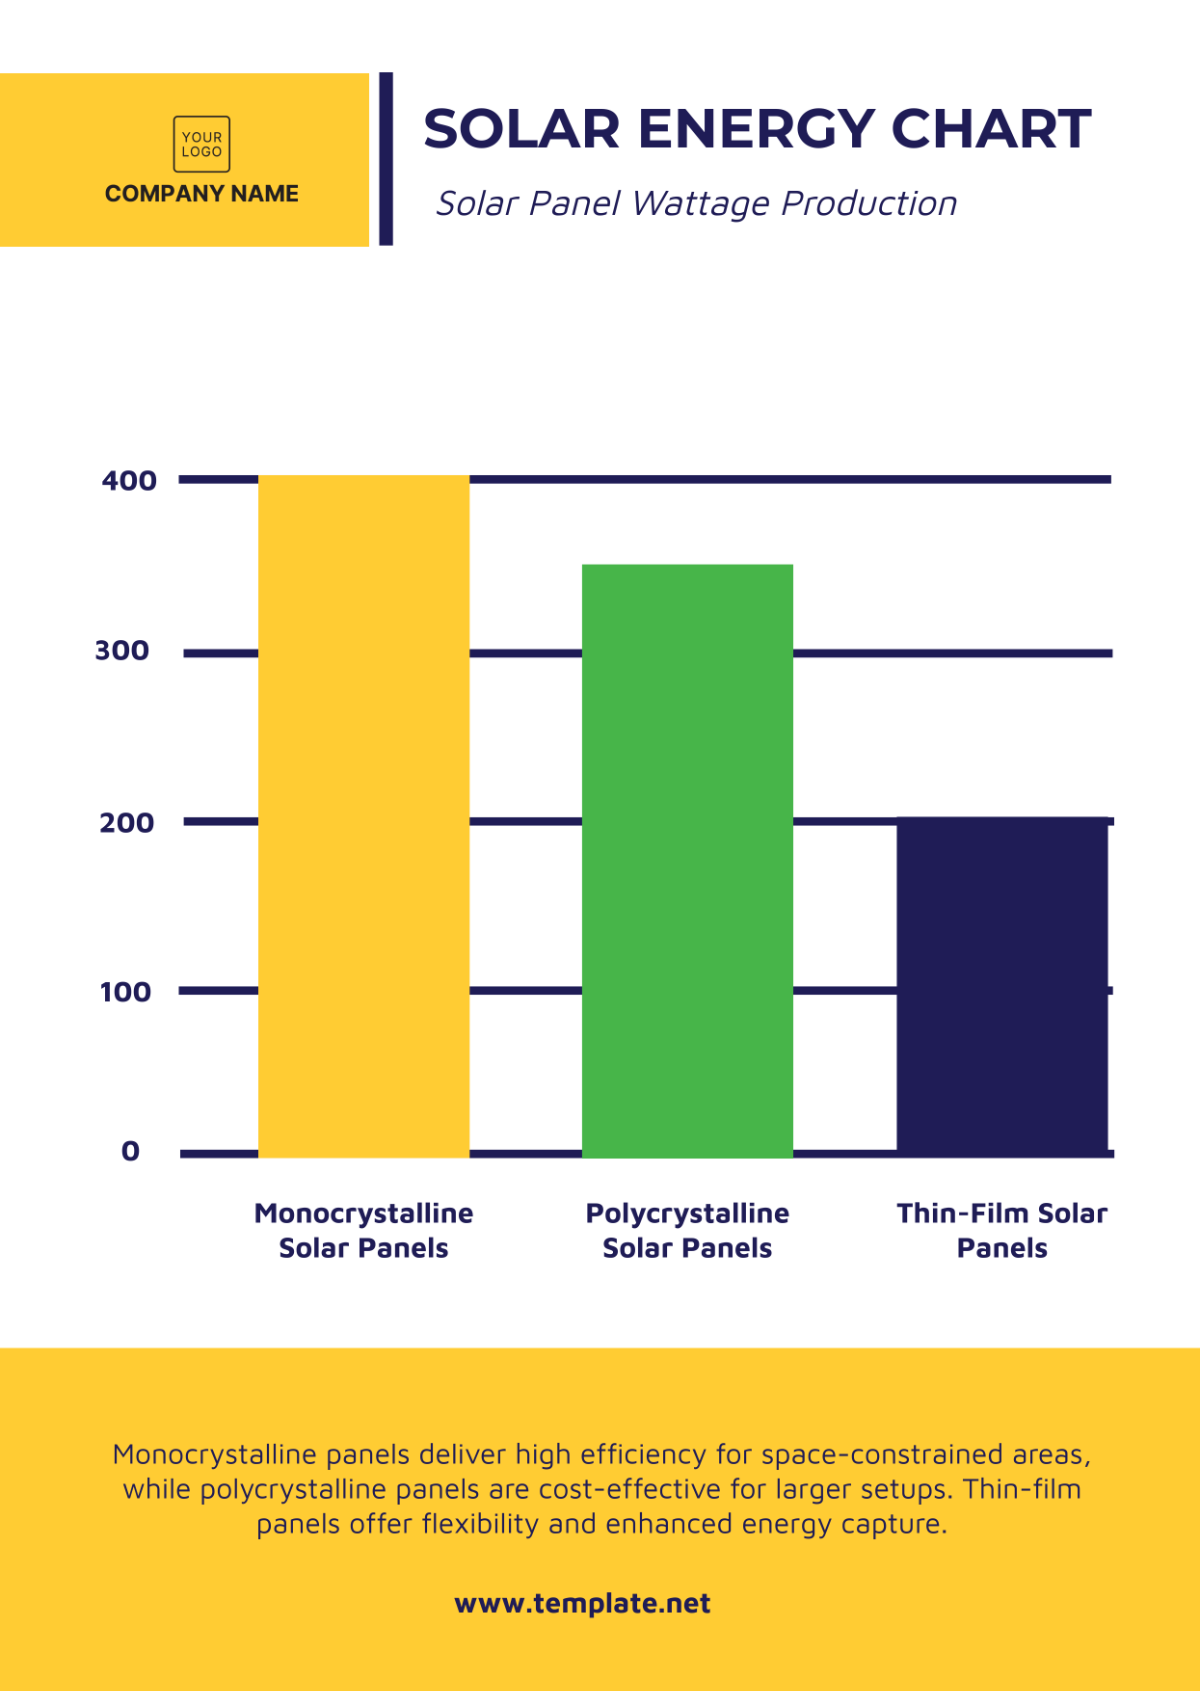
Solar Energy Chart Template
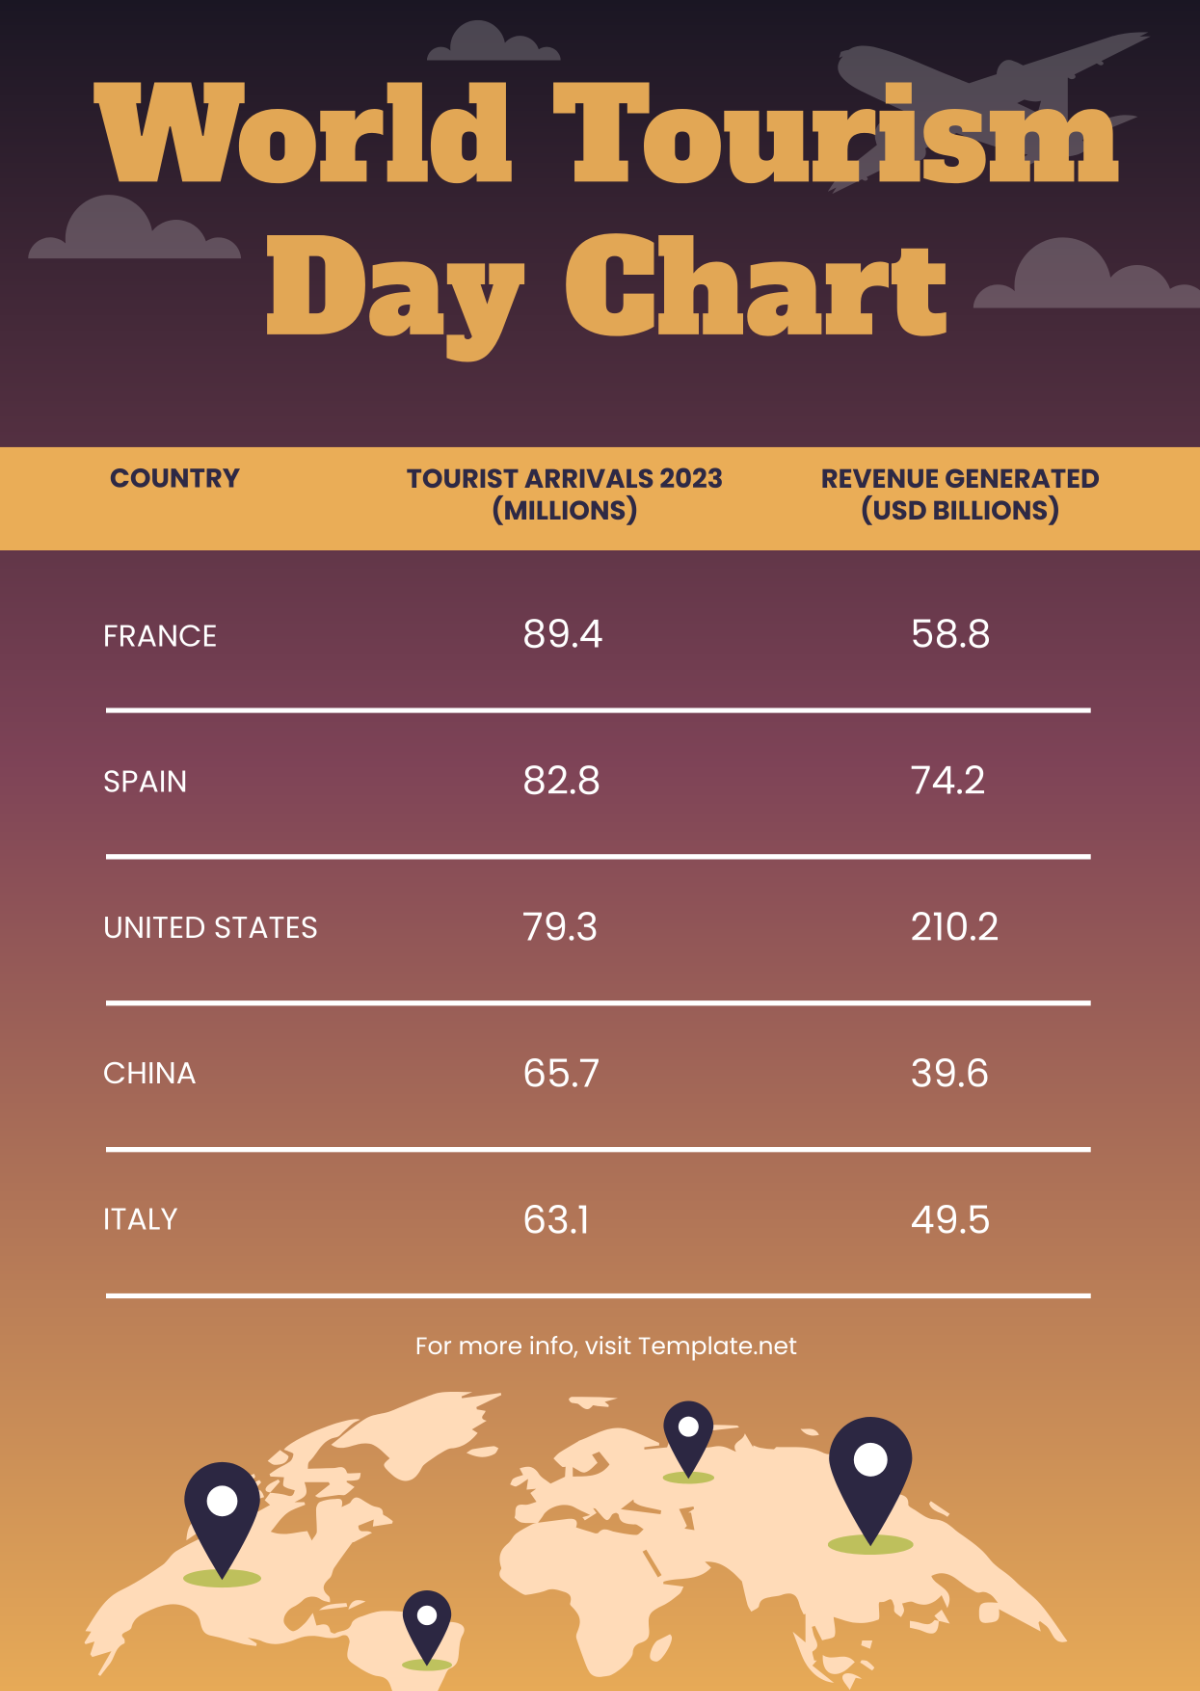
World Tourism Day Chart Template
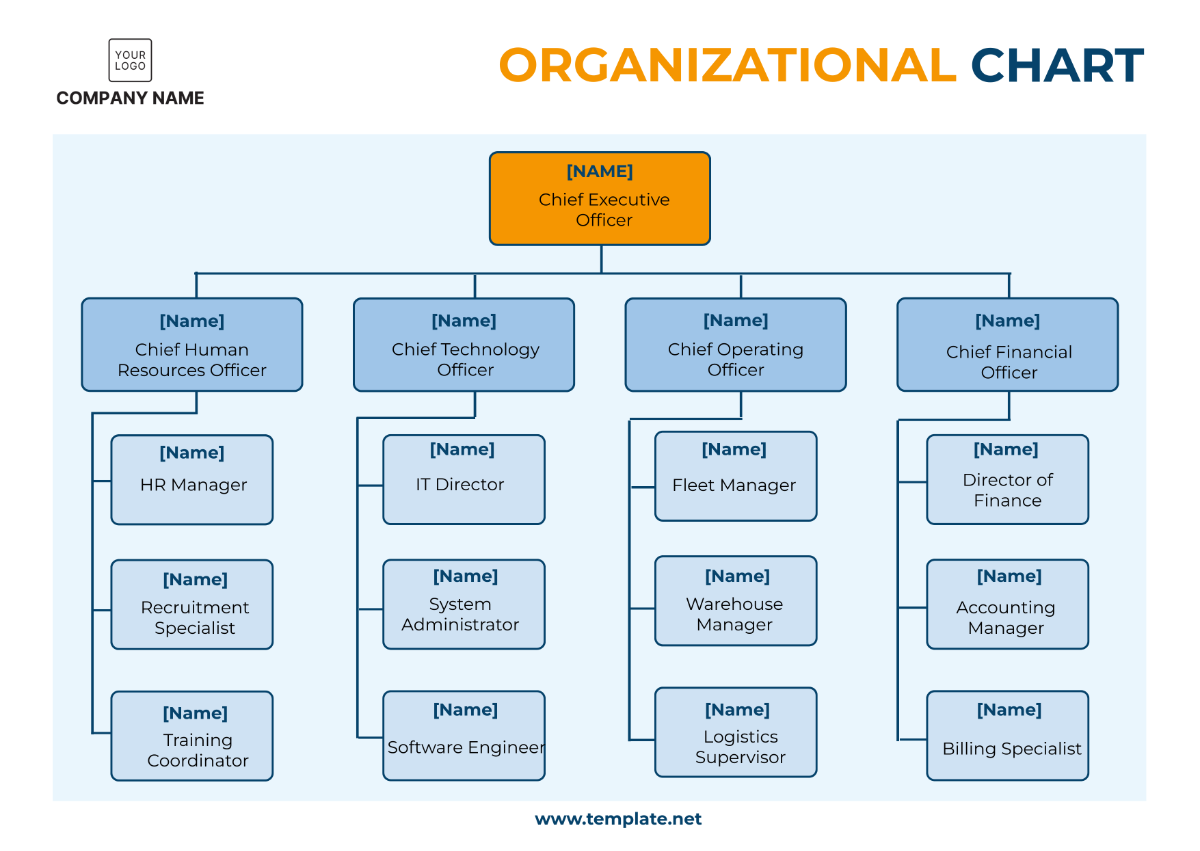
Transport and Logistics Organization Chart Template
- Body Temperature Chart
- Metric Chart
- Dress Size Chart
- Pregnancy Weight Gain Chart
- HCG Levels Chart
- Astrology Chart
- Blood Oxygen Level Chart
- Gauge Chart
- Sales Chart
- Marketing Chart
- Military Time Chart
- Pregnancy Food Chart
- Medical Chart
- Wedding Seating Chart
- Classroom Seating Chart
- Guitar Chord Chart
- Pedigree Chart
- Natal Chart
- Team Organizational Chart
- Diamond Color Chart
- Feelings Chart
- Piano Chord Chart
- Shoe Size Chart
- Activity Chart
- Height Weight
- Color Wheel Chart
- Chakra Chart
- Reflexology Chart
- Football Depth Chart
- Hospital Organizational Chart
- Radar Chart
- College Organizational Chart
- Color Mix Chart
- Column Chart
- Roman Numerals Chart
- Weather Chart
- Height Conversion Chart
- Food Calorie Chart
- Fundraising Chart
- Kids Chore Chart
- Donut Chart
- Incident Flow Chart
- Engineering Organizational Chart
- Patient Chart
- Church Organizational Chart
- Body Measurement Chart
- Synastry Chart
- Funnel Chart
- Weight Loss Chart
- Medical FlowChart
- Money Chart
- Research FlowChart
- Medical Organizational Chart
- Call Center FlowChart
- Pharma FlowChart
- Protein Chart
- Retail Organizational Chart
- Sports Organizational Chart
- Vitamin Chart
- Research Gantt Chart
- To Do Chart
- Tooth Chart
- Conjugation Chart
- Event FlowChart
- Gildan Size Chart
- Logistics Organizational Chart
- Manufacturing FlowChart
- Production FlowChart
- Bank Organizational Chart
- Change Management Flowchart
- Dental Chart
- Dissertation Gantt Chart
- DMC Color Chart
- Ecommerce Flowchart
- Payroll FlowChart
- Quality Control FlowChart
- Training FlowChart
- Training Gantt Chart
- University FlowChart
- Warehouse FlowChart
- Warehouse Organizational Chart
- Website Flowchart
- Army Weight Chart
- Communication FlowChart
- Employee Flowchart
- Hospital FlowChart
- Pharma Organizational Chart
- Travel Gantt Chart
- Behavior Flowchart
- Gaming FlowChart
- Insurance Organizational Chart
- Manufacturing Chart
- Progress Chart
- Travel FlowChart
- Travel Organizational Chart
- Charity FlowChart
- Church Flowchart
- Design Firm/Company Organizational Chart
- Hospital Gantt Chart
- Manufacturing Gantt Chart
- Nursing FlowChart
- Nursing Gantt Chart
- Recruitment Gantt Chart
- Website Gantt Chart
- Bank Flowchart
- Customer Service Flowchart
- Environment Organizational Chart
- Environmental Flowchart
- Fire Organizational Chart
- Insurance FlowChart
- Sports FlowChart
Download Free Printable Chart Templates
Template.net offers dozens of samples of different kinds of charts to choose from for companies, organizations, or personal requirements. Browse through professional chart designs, such as gantt charts, flow charts, organizational charts, timeline charts, seating charts, chore charts, and family tree chart templates. All are fully editable using our document editor tool and free to download anytime.
Customize Chart Template Online for Free and Download
Our Free Customizable Chart Templates come in blank, simple, basic, or creative examples that you can use for daily, weekly, or monthly schedules for medication, classroom evaluation, or inventory of business products. Have your choice of table, bar, or line graph charts that show exponential values in data that you’re gathering. Besides business requirements, we also have chart samples for weight loss and even birthdays to keep track of employee or student’s birthdays. All are fully editable and customizable to your specifications. Use our documents tool to change lines, graphs, text, and fonts, including illustrations and drawings that you need to include as relevant data. Download, edit online, and print easily in home or commercial printers or share online depending on your preference.
Frequently Asked Questions
What type of charts is essential for business operations.
Organizational charts and flowcharts are the most important documents used in business operations. The latter helps to organize the business structure in a hierarchy, and the former chart defines the process a work needs to undergo before its completion. These charts are useful for effective communication among employees and staff.
What are the Different Types of Organizational Charts?
- Flat Organizational Chart- It shows no levels of management and empowers employees with decision-making ability.
- Matrix Organizational Chart- It shows employees divided into teams and managed by a leader.
- Divisional Chart- It shows operations in divisional lines.
- Top-Down Hierarchy- It projects a top to the down hierarchy of an organization.
What are the Purposes of Chart?
The primary purpose of a chart is to communicate complex data clearly to the spectators and encourages further analysis and study of a subject. It also helps in establishing the crucial relationship between two data points, which otherwise could not be easy to project in words.
What are the Different Components of Charts?
- Chart area- Here, you can enter the chart.
- Data series- It refers to the row and columns carrying numbers and figures.
- Axes- It refers to the x-axis and y-axis of a chart.
- Plot area- It is the main chart workspace.
- Gridlines- These are for reference.
What is the Importance of charts?
Charts are essential sources to project and represent data in any platform for better public understanding and communication. It best describes the developing trend in any business or works in a graphical manner using respective symbols of each chart type.
Download unlimited Chart Templates!
- Activity Diagram (UML)
- Amazon Web Services
- Android Mockups
- Block Diagram
- Business Process Management
- Chemical Chart
- Cisco Network Diagram
- Class Diagram (UML)
- Collaboration Diagram (UML)
- Compare & Contrast Diagram
- Component Diagram (UML)
- Concept Diagram
- Cycle Diagram
- Data Flow Diagram
- Data Flow Diagrams (YC)
- Database Diagram
- Deployment Diagram (UML)
- Entity Relationship Diagram
- Family Tree
- Fishbone / Ishikawa Diagram
- Gantt Chart
- Infographics
- iOS Mockups
- Network Diagram
- Object Diagram (UML)
- Object Process Model
- Organizational Chart
- Sequence Diagram (UML)
- Spider Diagram
- State Chart Diagram (UML)
- Story Board
- SWOT Diagram
- TQM - Total Quality Management
- Use Case Diagram (UML)
- Value Stream Mapping
- Venn Diagram
- Web Mockups
- Work Breakdown Structure
Master Thesis [classic]
You can easily edit this template using Creately's gantt chart maker . You can export it in multiple formats like JPEG, PNG and SVG and easily add it to Word documents, Powerpoint (PPT) presentations, Excel or any other documents. You can export it as a PDF for high-quality printouts.
- Flowchart Templates
- Org Chart Templates
- Concept Map Templates
- Mind Mapping Templates
- WBS Templates
- Family Tree Templates
- VSM Templates
- Data Flow Diagram Templates
- Network Diagram Templates
- SWOT Analysis Templates
- Genogram Templates
- Business Model Canvas
- Pedigree Chart Templates
- Activity Diagram Templates
- Amazon Web Services Templates
- Android Mockups Templates
- Block Diagram Templates
- Business Process Management Templates
- Chemical Chart Templates
- Cisco Network Diagram Templates
- Class Diagram Templates
- Collaboration Diagram Templates
- Compare & Contrast Diagram Templates
- Component Diagram Templates
- Concept Diagram Templates
- Cycle Diagram Templates
- Data Flow Diagrams(YC) Templates
- Database Diagram Templates
- Deployment Diagram Templates
- Entity Relationship Diagram Templates
- Fishbone Diagram Templates
- Gantt Chart Templates
- Infographic Templates
- iOS Mockup Templates
- KWL Chart Templates
- Logic Gate Templates
- Mind Map Templates
- Object Diagram Templates
- Object Process Model Templates
- Organizational Chart Templates
- Other Templates
- PERT Chart Templates
- Sequence Diagram Templates
- Site Map Templates
- Spider Diagram Templates
- State Chart Diagram Templates
- Story Board Templates
- SWOT Diagram Templates
- T Chart Templates
- TQM - Total Quality Management Templates
- UI Mockup Templates
- Use Case Diagram Templates
- Value Stream Mapping Templates
- Venn Diagram Templates
- Web Mockup Templates
- Y Chart Templates
Related Templates

IMAGES
COMMENTS
Oct 17, 2024 · Why Is a Gantt Chart for a Dissertation Important? There are many reasons why a dissertation Gantt chart for a thesis is important, but it provides a visual look and solves challenges easily while writing a dissertation discussion section. Time Management:- The dissertation helps in efficient time planning and management. You can promise that ...
Jan 26, 2023 · How to Create a Gantt Chart. Creating a Gantt chart for a dissertation is simple. First, you need to enter your task names, durations, and start dates into an Excel spreadsheet and then use the built-in tools to insert a Gantt chart. There are the following steps: Start with a blank Gantt chart and customize it according to your needs.
Customize dissertation Gantt chart examples online to your specifications including the plan and timeline by replacing or editing the pre-written content to your own requirements. Choose your Gantt chart template to help your dissertation as a PhD student for a master thesis university requirement, a construction project, marketing plan, or ...
Jul 28, 2022 · This tutorial covers how to create a Gantt chart from start to finish. Feel free to ask any questions or leave a comment.Hire writers - https://www.smartwrit...
Oct 13, 2021 · You are a student about to become a postgraduate because you are currently focusing on your master thesis? You might need a little support when it comes to organizing your time and planning the various things you have to do?
Jan 26, 2023 · The Benefits of Using a Dissertation Gantt Chart. No one knows the feeling of sitting in front of a blank whiteboard, trying to figure out how to write a dissertation. The process can seem daunting and overwhelming, but using a Gantt Chart can make the entire process much easier. A Gantt Chart is simply a chart that helps you plan and track ...
Sep 25, 2024 · The Gantt chart shows the timelines of the various steps of the project including their dependencies and any resources needed. In other words, the chart depicts when an event is supposed to take place in your project by providing an outline regarding the order in which the various tasks need to be performed. An example of a Gantt chart.
Jun 14, 2023 · Additional Tips for Dissertation Gantt Chart Here are some additional tips for using a dissertation Gantt chart: Use a software program to create your Gantt chart. There are many different software programs that you can use to create a Gantt chart. Some popular options include Microsoft Excel, Google Sheets, and Trello. Make your Gantt chart ...
To manage your time in writing your dissertation, guidelines are provided below to help you design the appropriate Gantt chart in Microsoft Excel. 1. Fully Understand the Research Topic. Regardless of the topic, it’s very important to understand it thoroughly for the sake of your Gantt chart and dissertation. What is the scope of your topic?
You can easily edit this template using Creately's gantt chart maker.You can export it in multiple formats like JPEG, PNG and SVG and easily add it to Word documents, Powerpoint (PPT) presentations, Excel or any other documents.